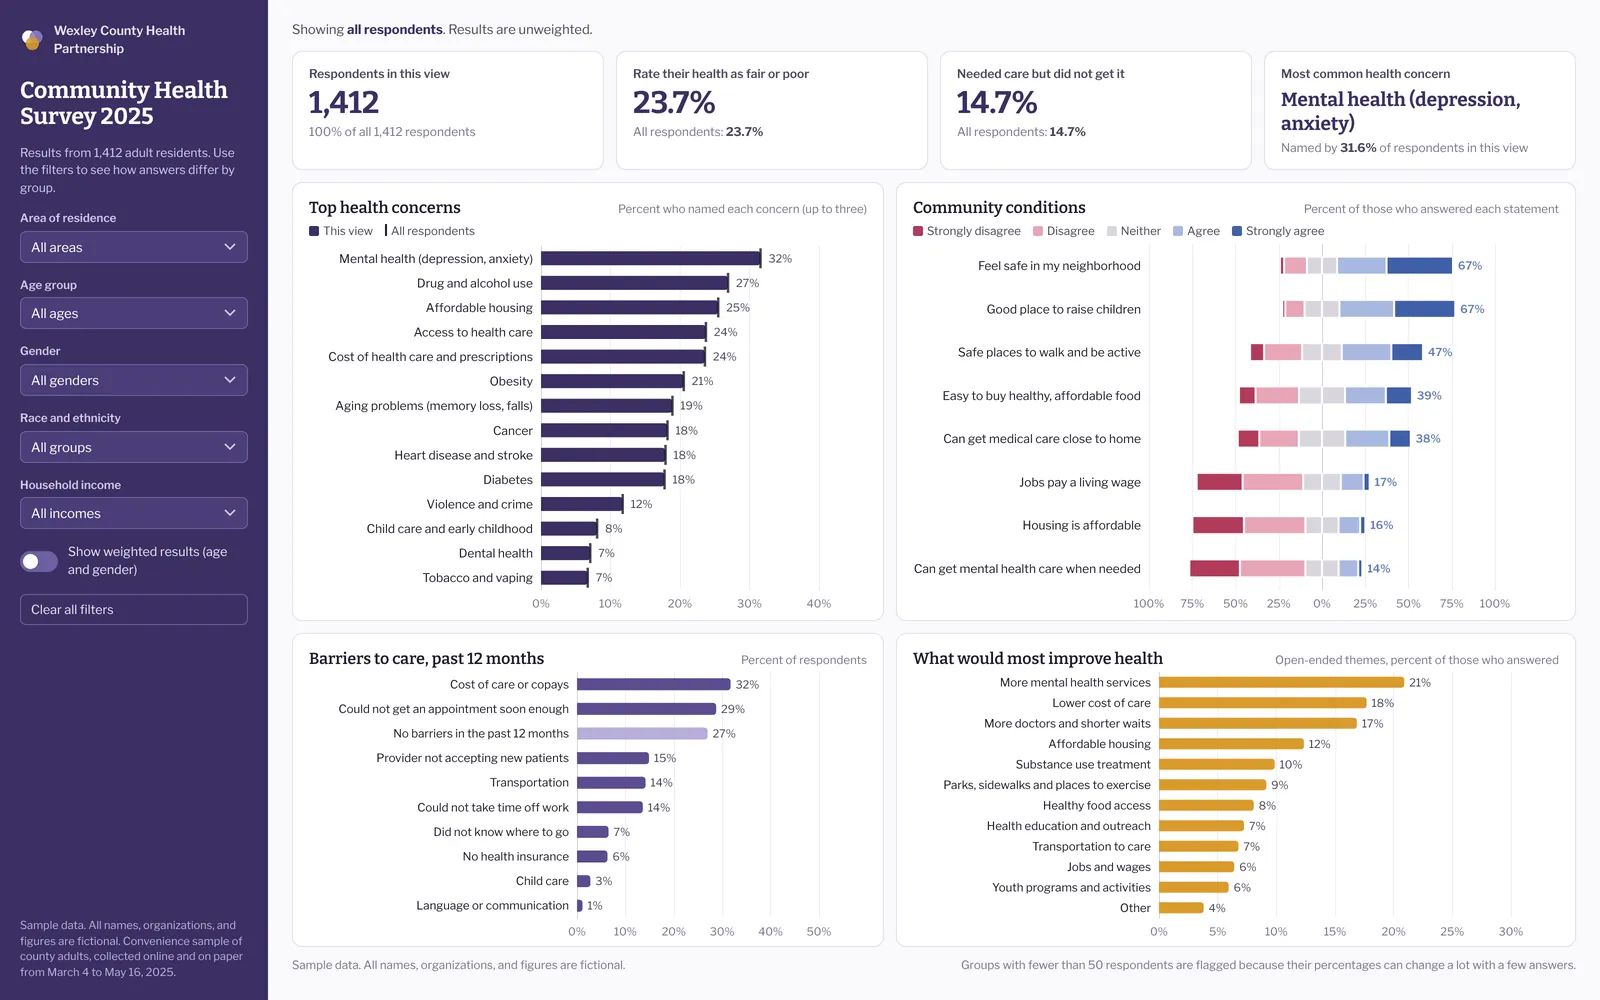
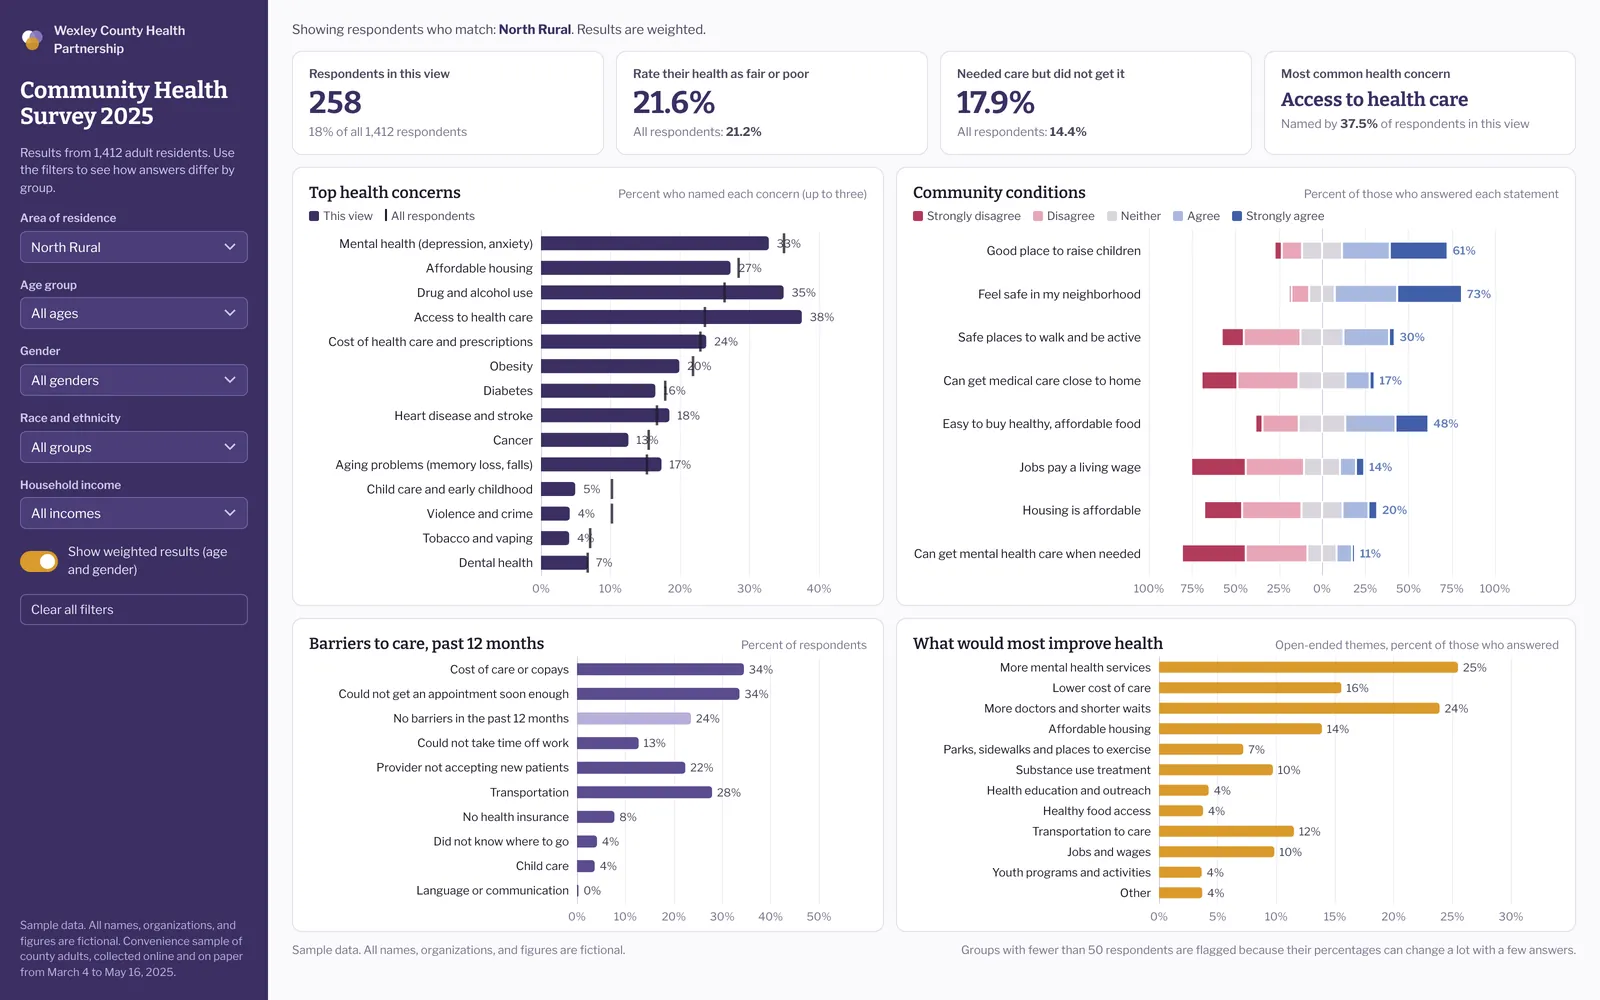
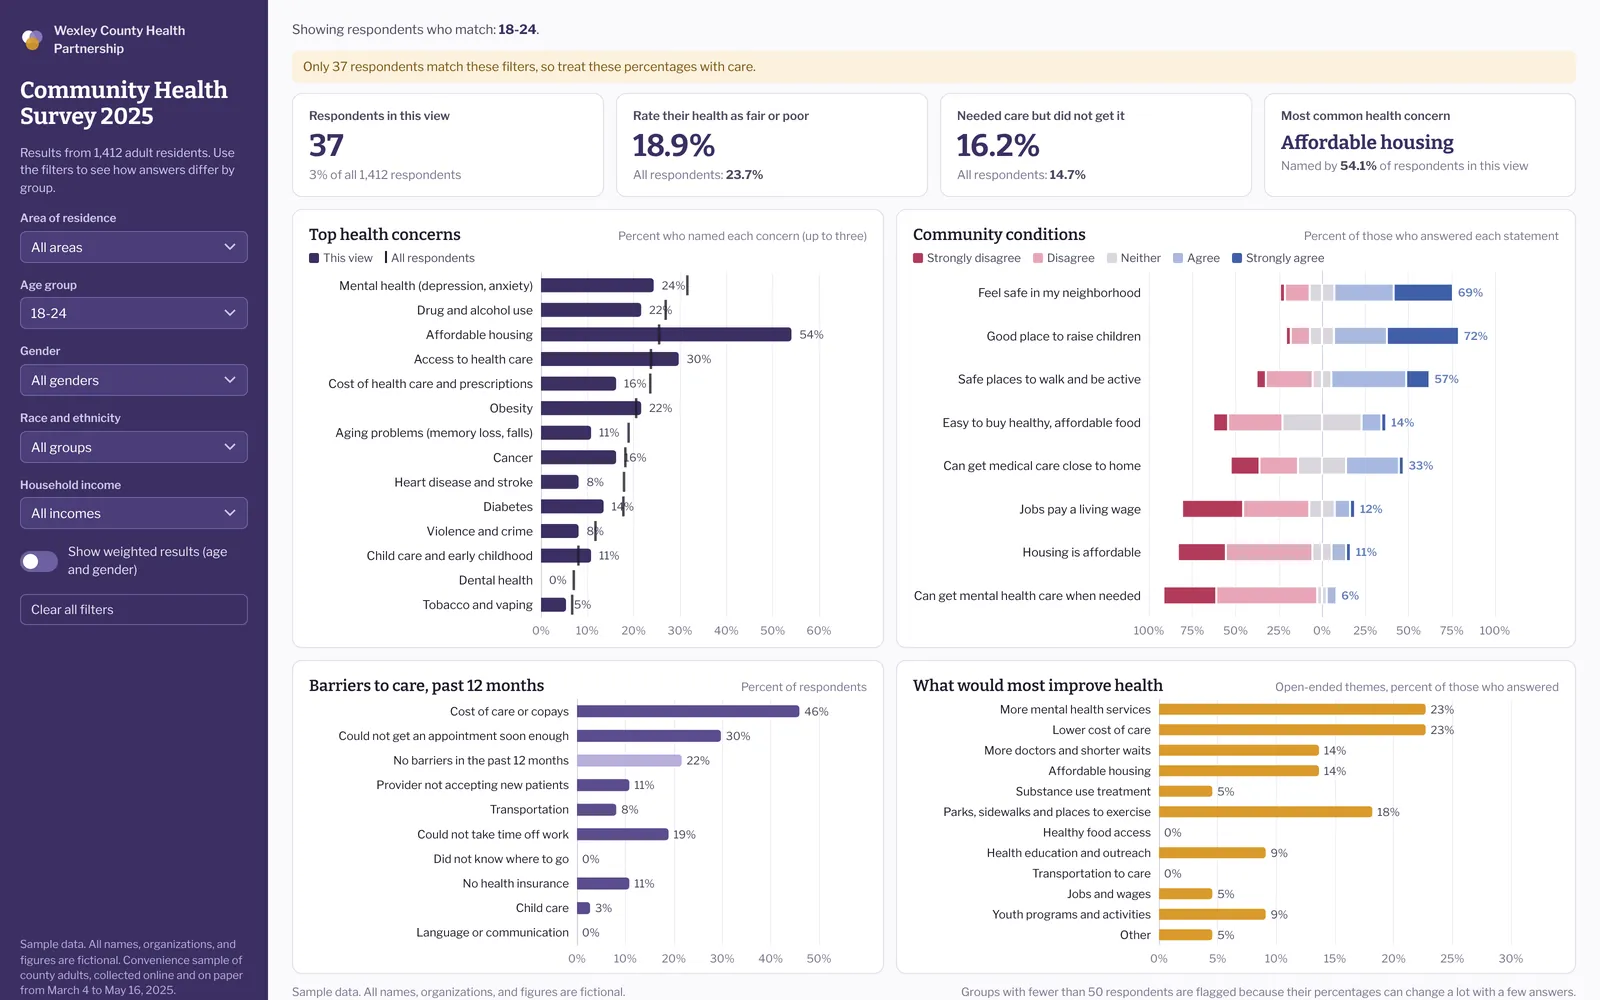
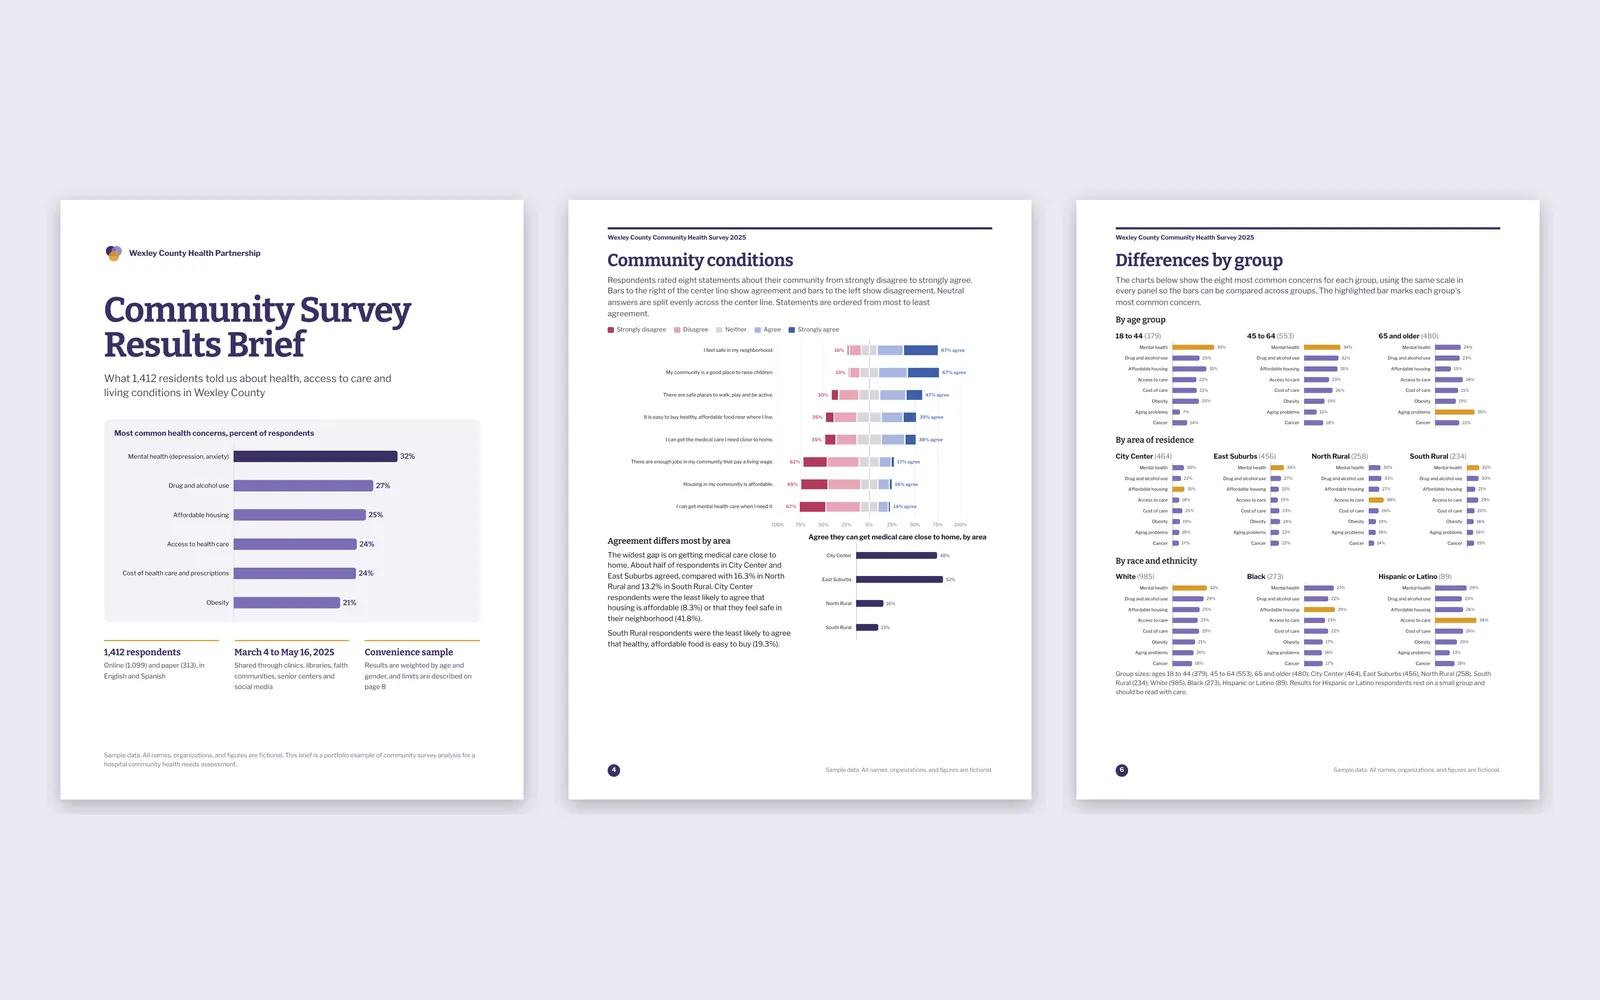
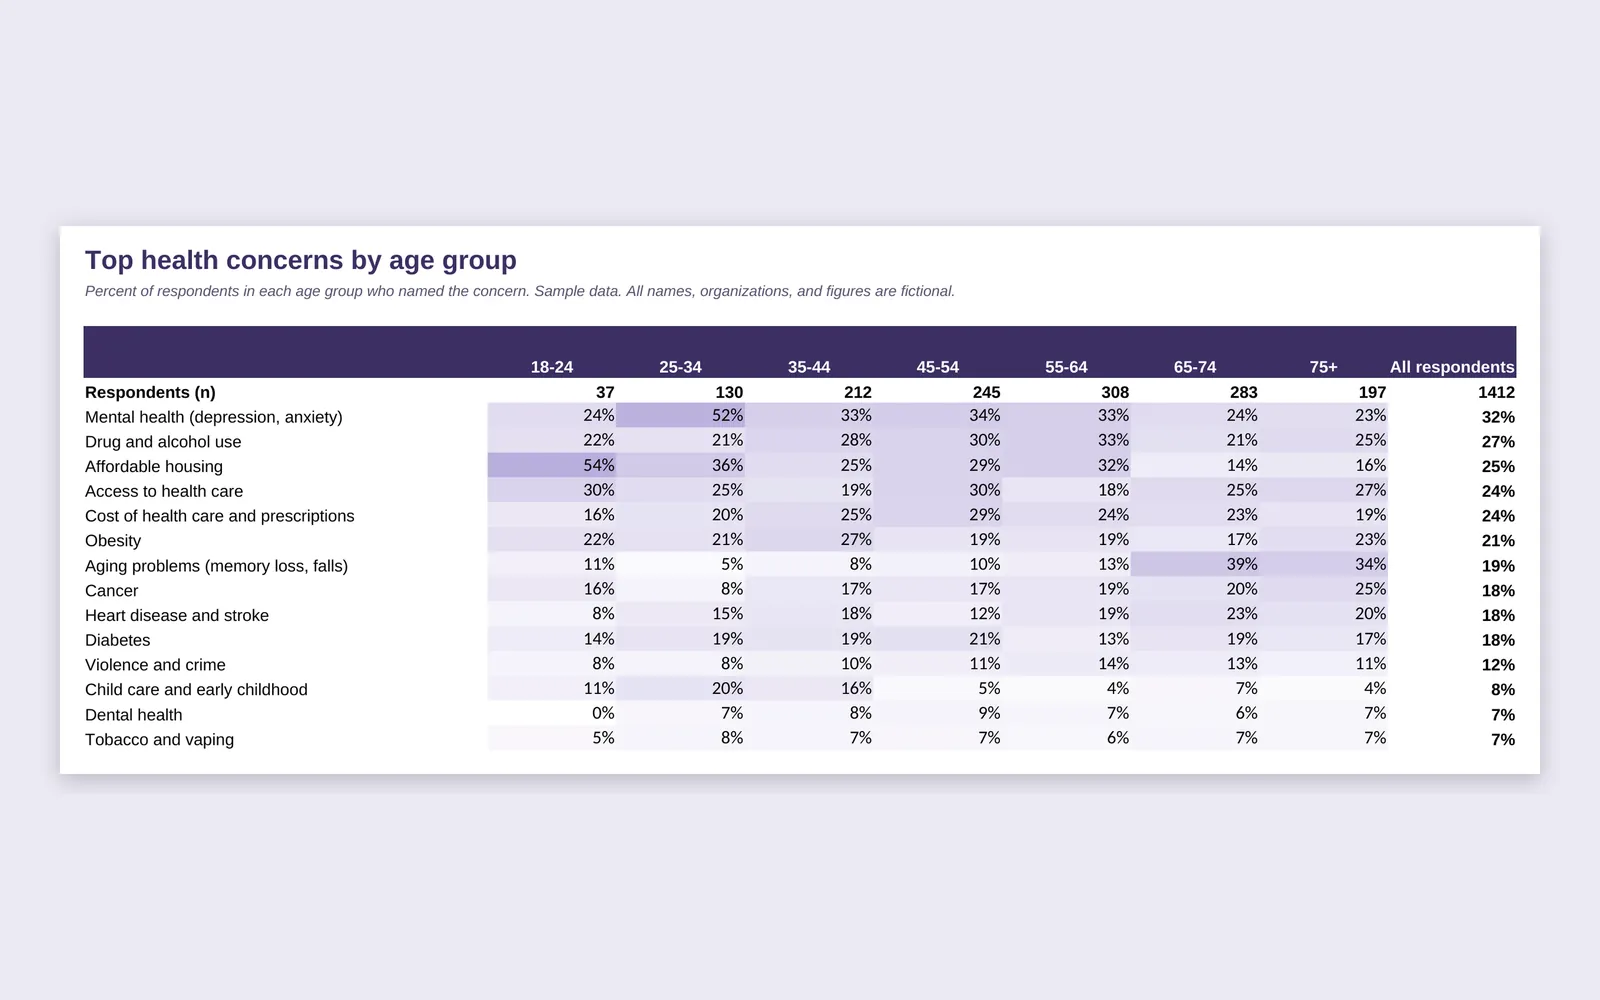
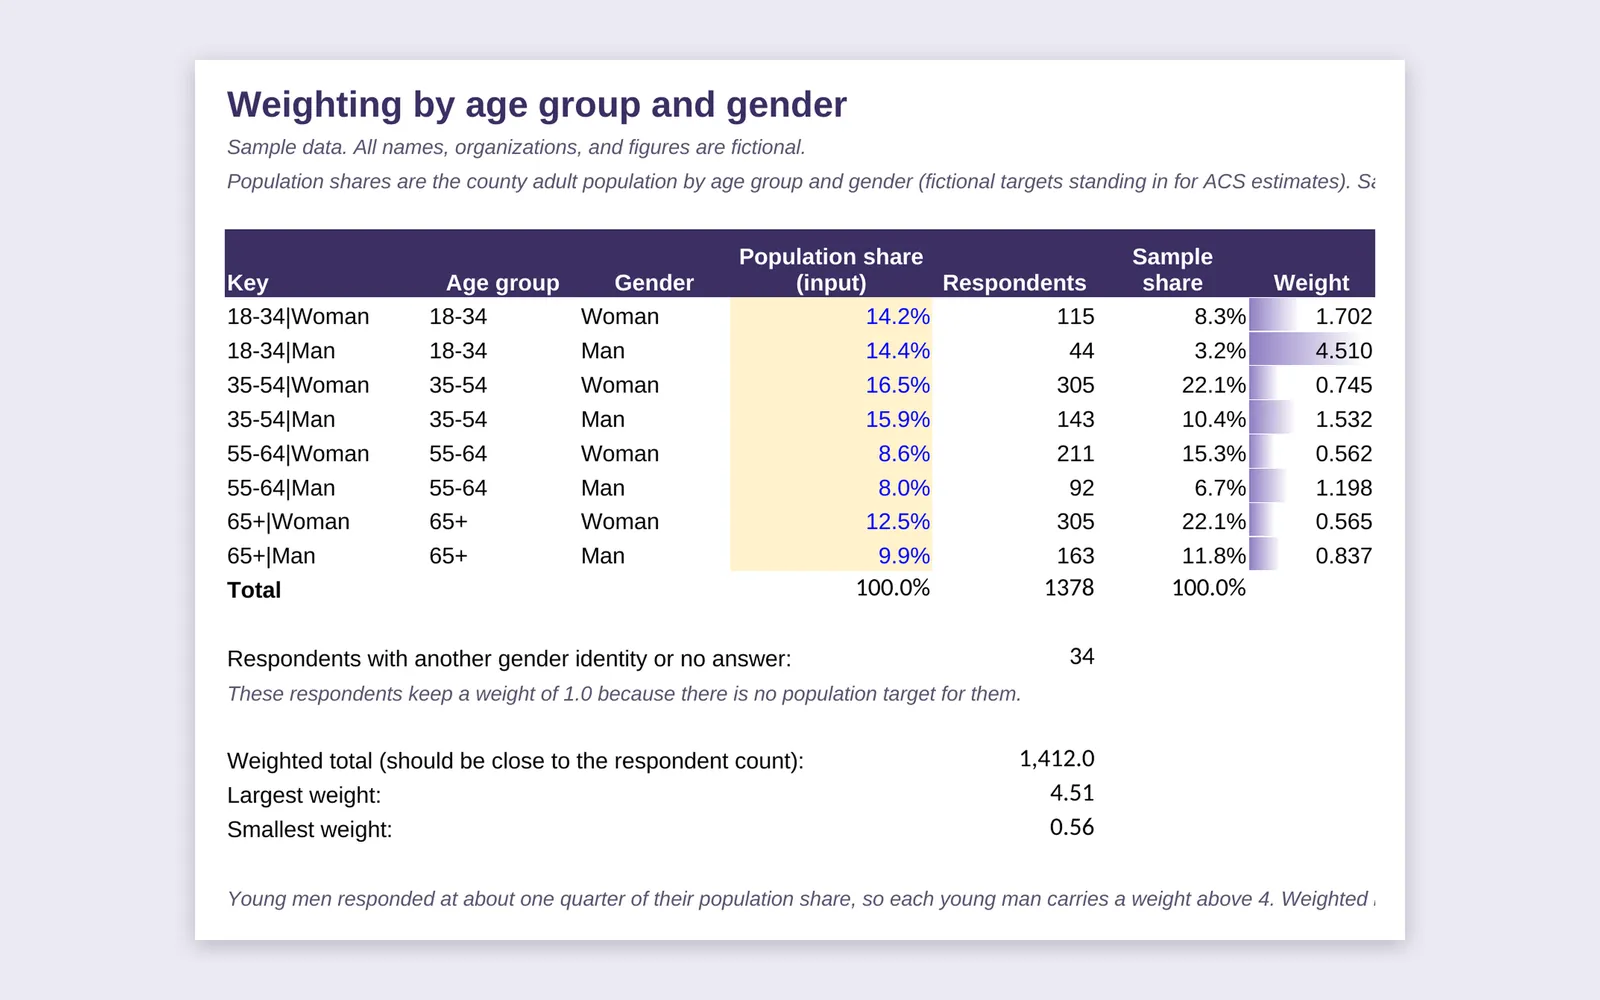
This product shows how community survey responses are cleaned, coded and reported for a needs assessment. The sample survey asks residents about their own health, conditions in their community, their top health concerns, barriers to care and what would most improve health, and the open-ended answers are coded into themes. Results are broken out by age, income, race and ethnicity and area of residence, and they are reported both unweighted and weighted to the county's age and gender mix.
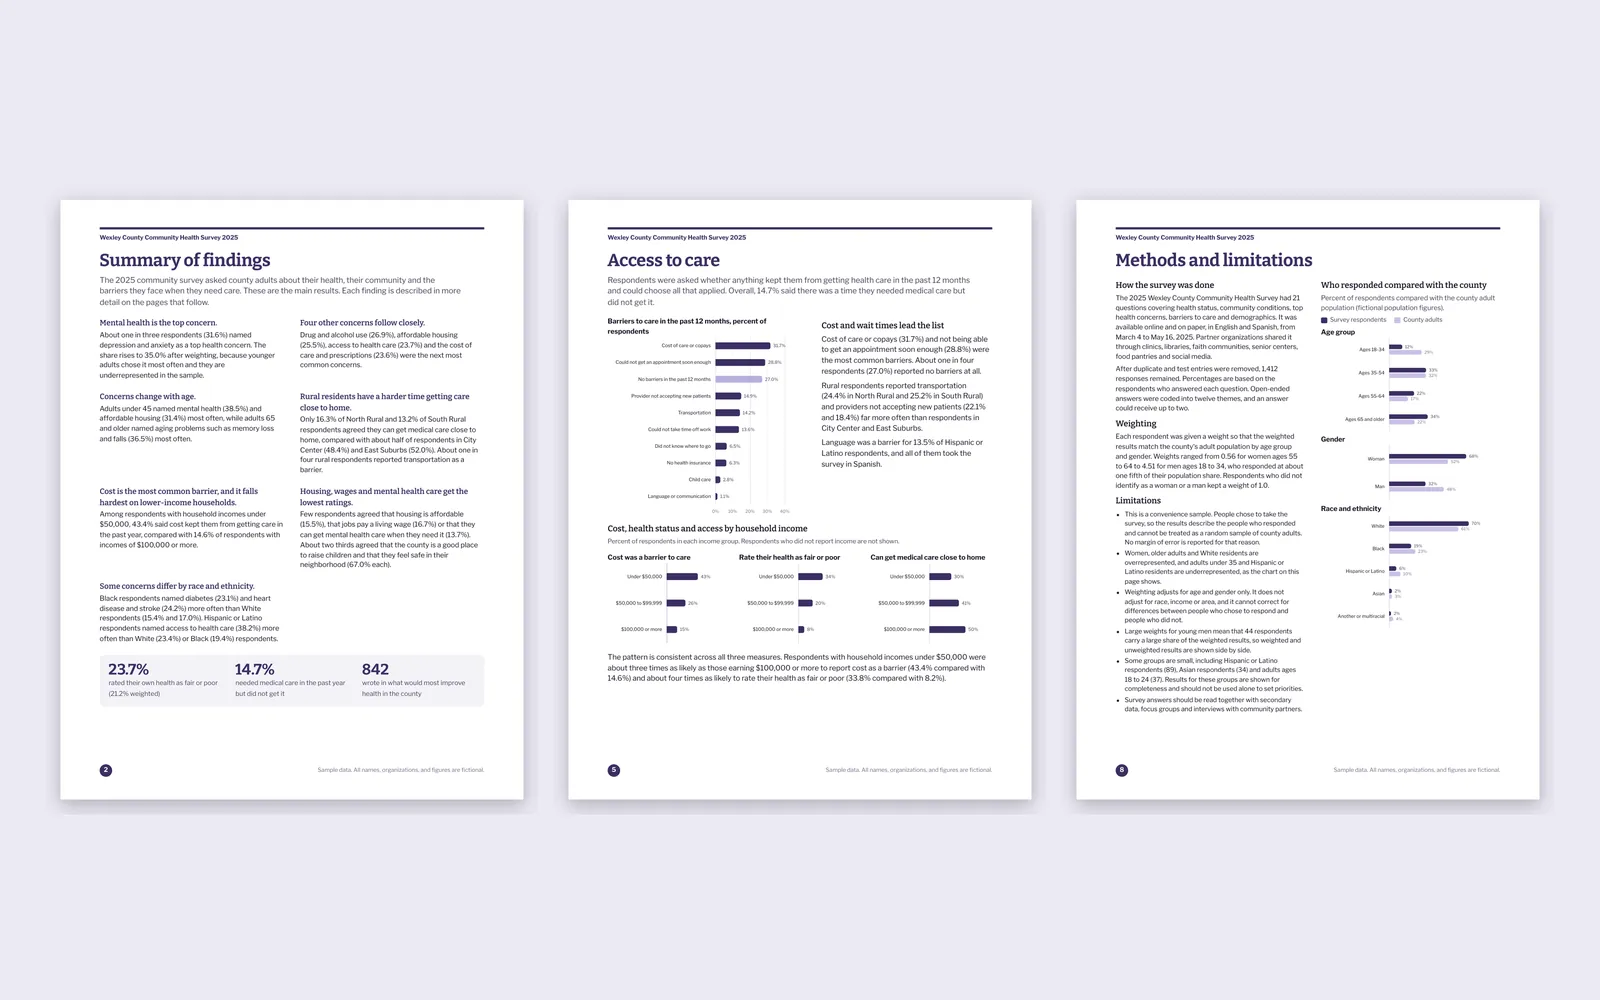
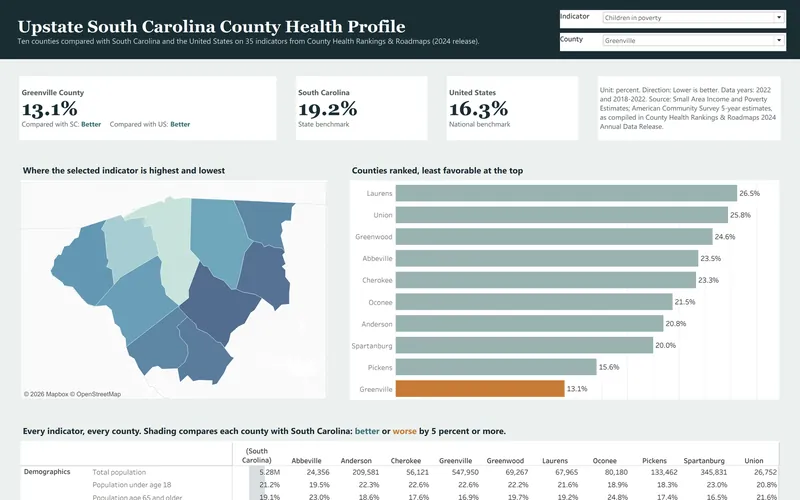
The results brief has a summary of findings, ranked concerns, diverging bars for the agreement statements, small multiples by group, resident quotes and a methods page that is plain about the limits of a convenience sample. The dashboard lets a reader filter by group and switch weighting on and off, and it warns when a filtered group is too small to read with confidence. The Excel workbook builds every crosstab with COUNTIFS and SUMPRODUCT formulas so new responses flow through.