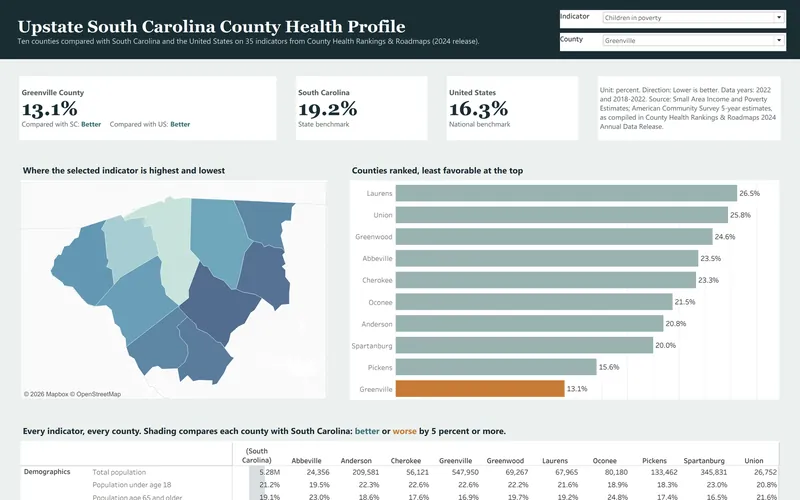
This is the secondary data profile from a community health needs assessment for ten Upstate South Carolina counties, and it is built from the 2024 County Health Rankings release. It compares 35 county indicators with state and national values and turns them into a dashboard, a 14-page report and an Excel workbook.
Public data
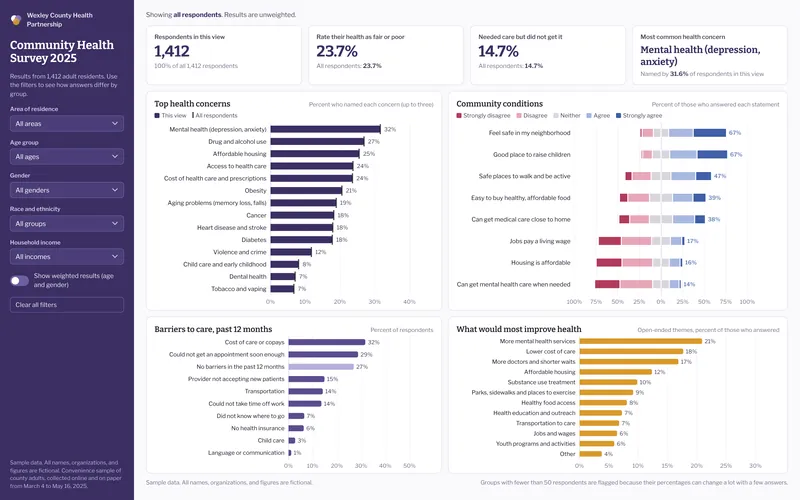
This sample analyzes a fictional county community health survey with 1,412 respondents, which is the kind of survey hospitals run as part of a community health needs assessment. It includes a filterable dashboard, an 8-page results brief and an Excel workbook with crosstabs, a codebook and weighting.
Sample data
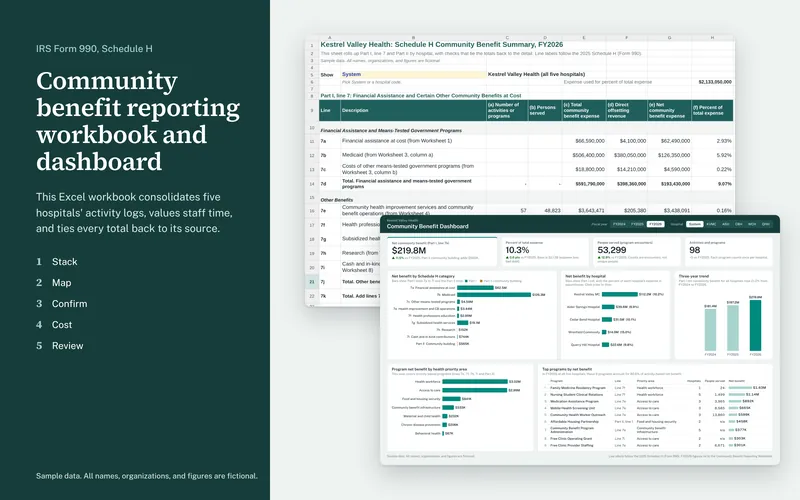
This Excel workbook consolidates five hospitals' community benefit activity logs into one dataset and rolls it up to the lines of IRS Form 990, Schedule H. Every total on the summary ties back through formulas to the row a hospital reported.
Sample data
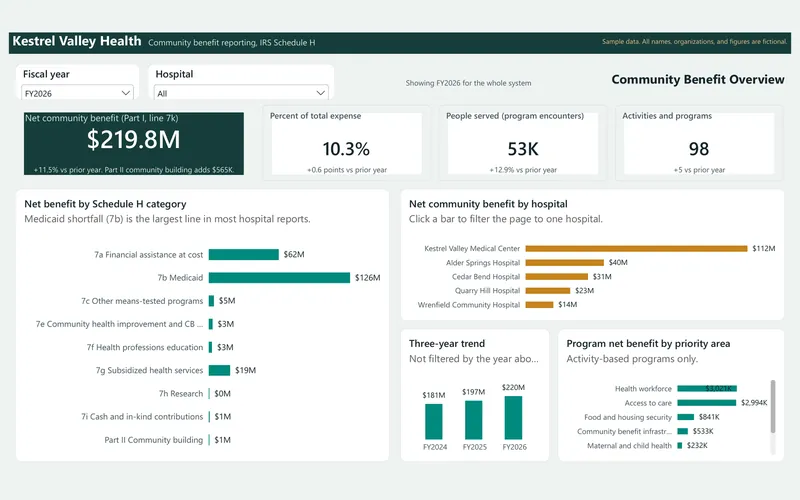
This interactive dashboard shows a hospital system's community benefit across three fiscal years, built from the same sample data as the reporting workbook. It comes with star-schema data files, a Power BI theme, and a rebuild guide with every DAX measure.
Sample data
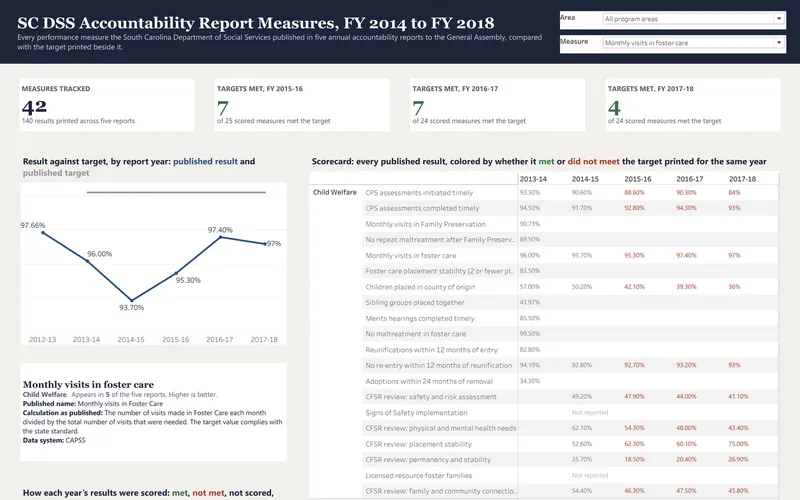
This dashboard and workbook pull every performance measure from five South Carolina Department of Social Services annual accountability reports into one table, link each measure across years, and compare each result with the target printed beside it. Brad prepared four of these reports as the agency's Director of Accountability, Data and Research.
Public data
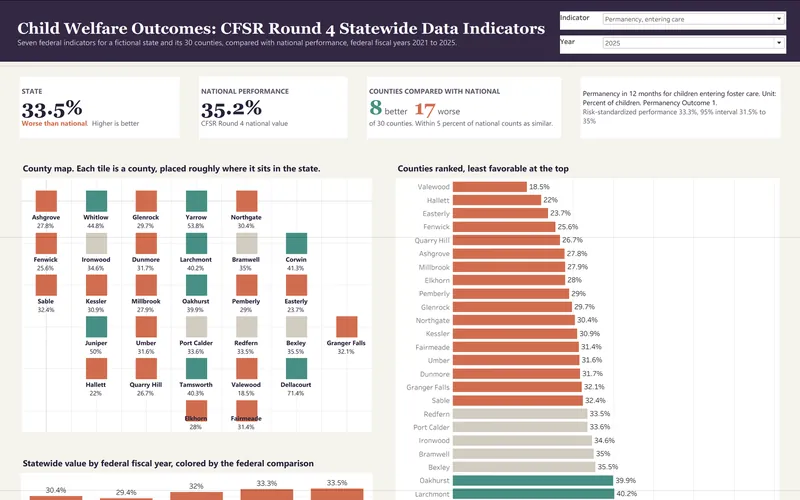
This five-page dashboard tracks the seven federal CFSR Round 4 statewide data indicators for a fictional state with 30 counties over five federal fiscal years. It compares the state with national performance the way the federal data profiles do and shows where counties differ from the state.
Sample data
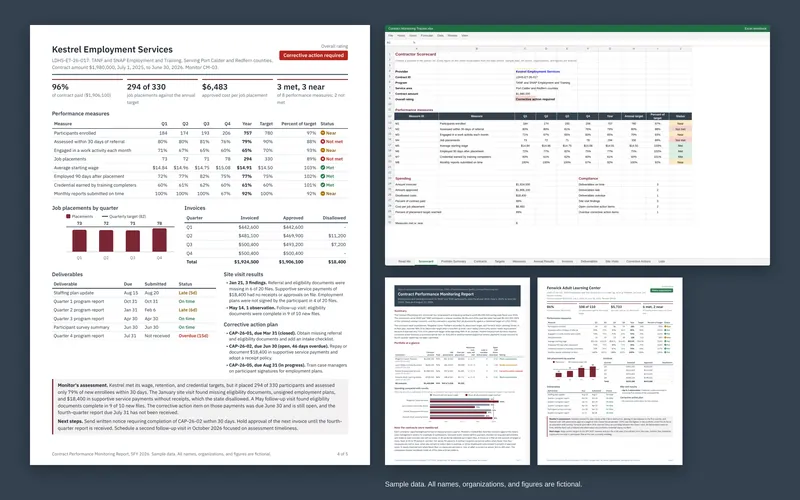
This Excel tracker and 5-page report monitor four fictional employment and training contracts that serve SNAP and TANF participants. Together they tie spending to results and rate each contractor on performance, deliverables, site visit findings, and corrective action status.
Sample data
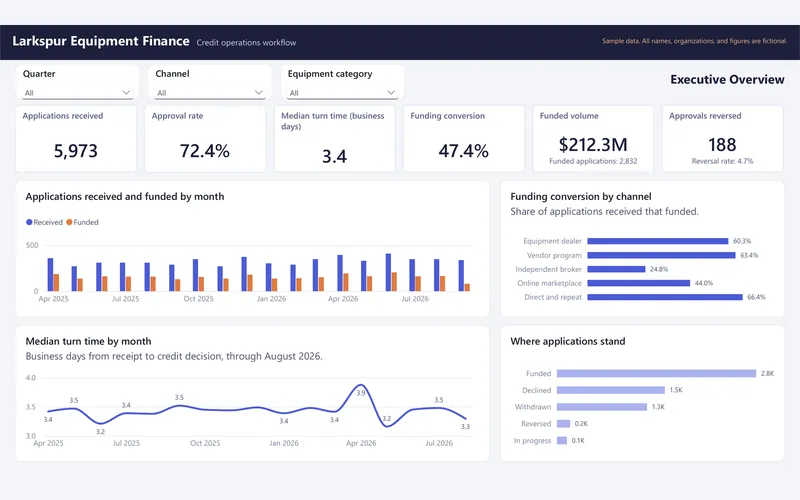
This is a seven-page operations dashboard for the credit team of a fictional equipment finance company. It tracks about 6,000 applications, 47,000 workflow steps, and 9,600 document requests over 18 months, and it shows turn time, document waits, decisions, reversals, and funding conversion.
Sample data
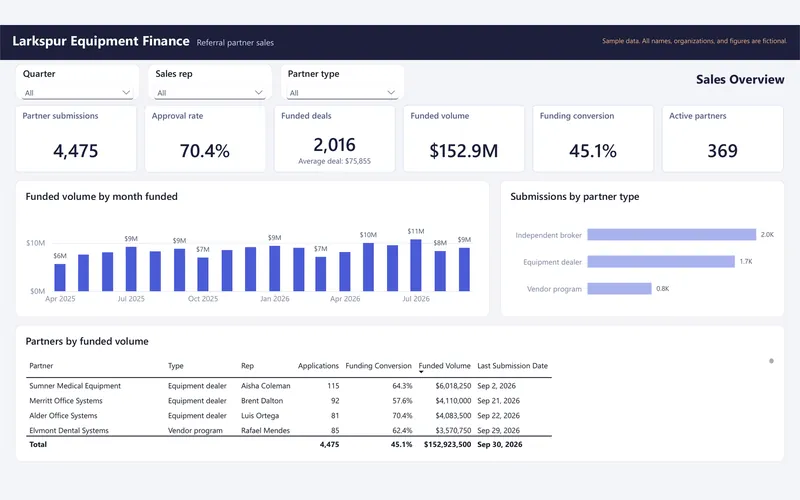
This is a six-page sales dashboard for a fictional equipment finance company that gets most of its business through about 400 referral partners and 10 sales reps. It tracks submissions, approvals, and funding, scores the health of each established partner, and prints a weekly outreach list for each rep.
Sample data
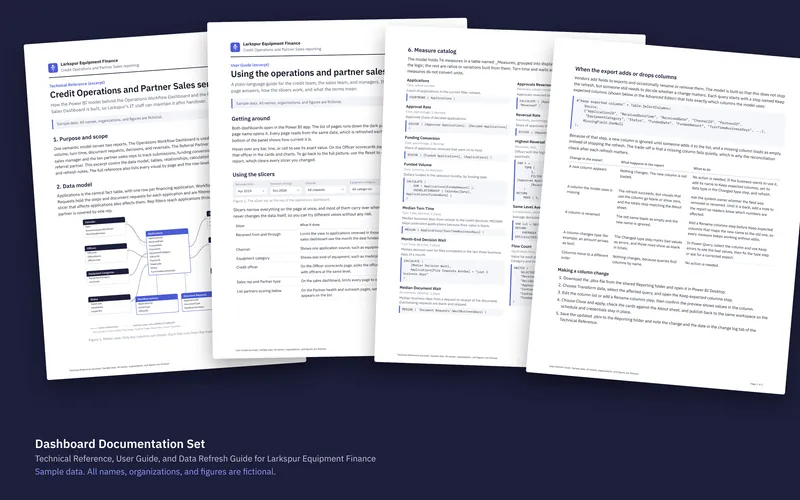
This set holds three short handover documents for the operations and partner sales dashboards: a technical reference for IT staff, a plain-language user guide, and a data refresh guide. Together they show how a Power BI model is handed to a client so their own staff can run and maintain it.
Sample data
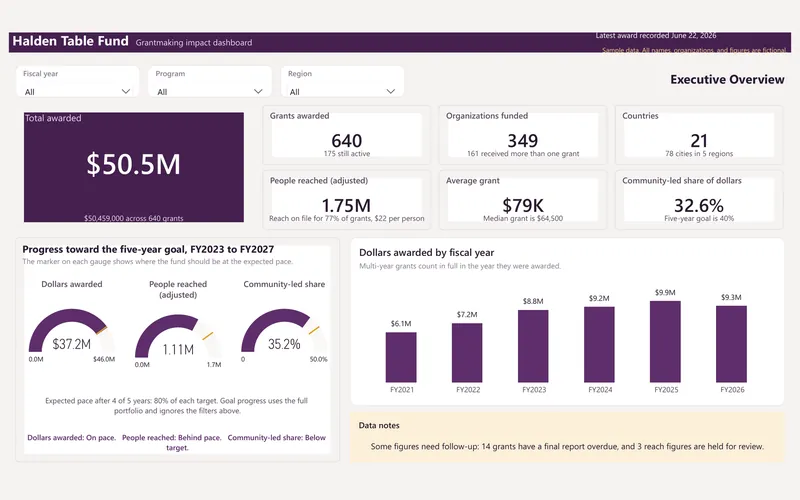
This is an executive dashboard for a corporate foundation's global grant program, covering six fiscal years, 640 grants, and $50.5 million in awards. It shows where the money went, who it reached, and how the fund is tracking against its five-year goal.
Sample data
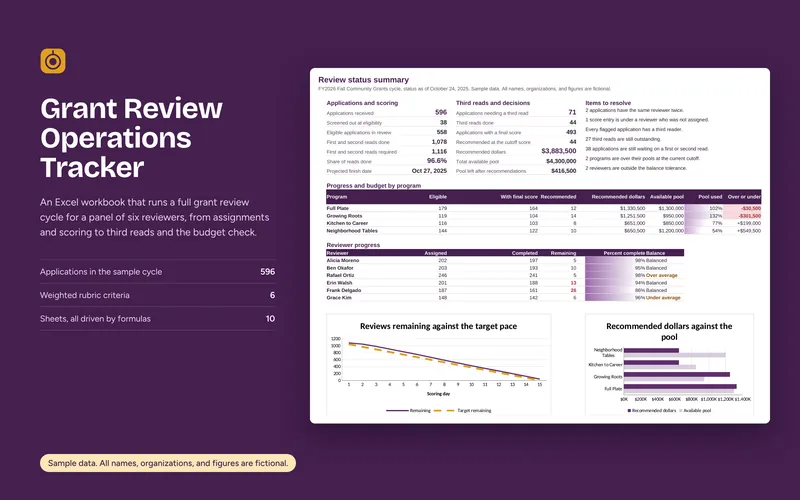
This is an Excel workbook for running a grant review cycle with a panel of six to eight reviewers. It tracks assignments, scores, daily pace, third reads, and whether recommended awards fit each program's budget.
Sample data
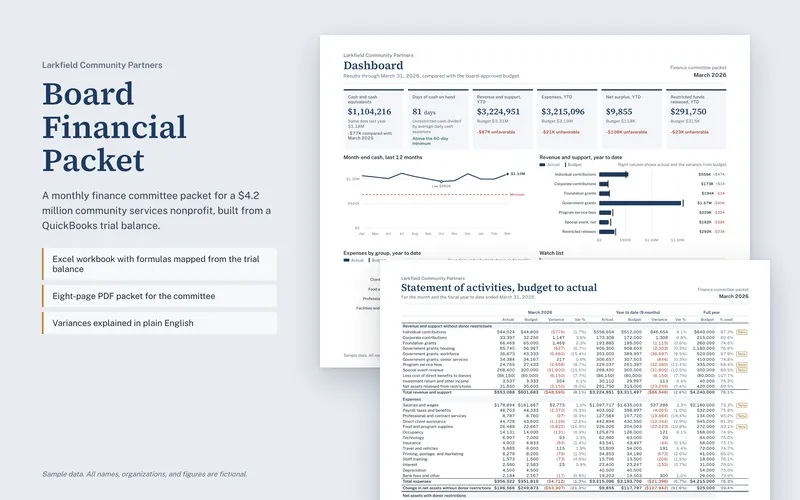
This is a monthly finance committee packet for a fictional $4.2 million community services nonprofit. The Excel workbook builds every report from a QuickBooks trial balance, and the matching eight-page PDF is what the committee reads.
Sample data
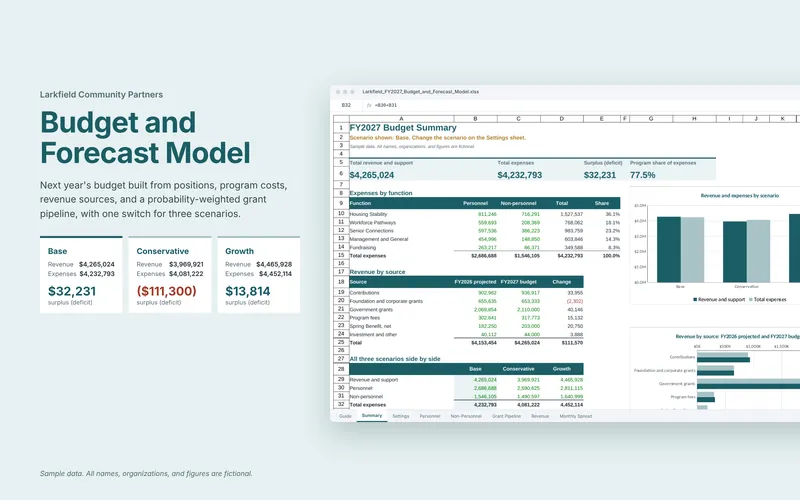
This Excel model builds a nonprofit's next-year budget from positions, program costs, and revenue sources. A single switch on the settings sheet moves the whole model between base, conservative, and growth scenarios.
Sample data
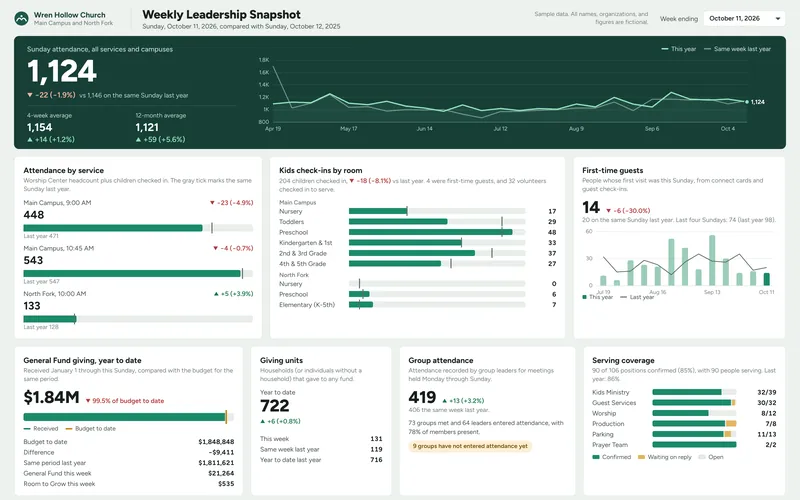
A one-page weekly dashboard for a senior pastor and staff that compares Sunday with the same Sunday last year. It brings attendance, kids check-ins, first-time guests, giving against budget, groups, and serving coverage from Planning Center into one view.
Sample data
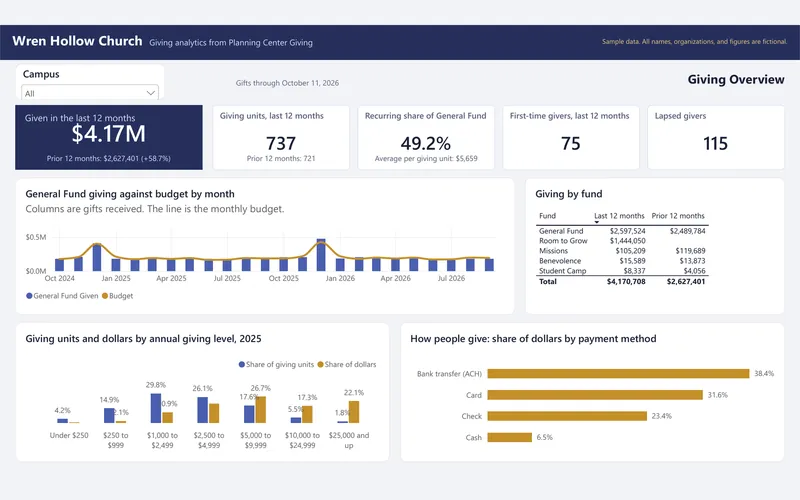
A four-page giving dashboard for a church finance team: giving units, recurring share, first-time and lapsed givers, giving bands, fund mix, monthly giving against budget, and a building campaign tracker. It comes with a Power BI rebuild kit that includes the data tables, a theme file, and every DAX measure.
Sample data
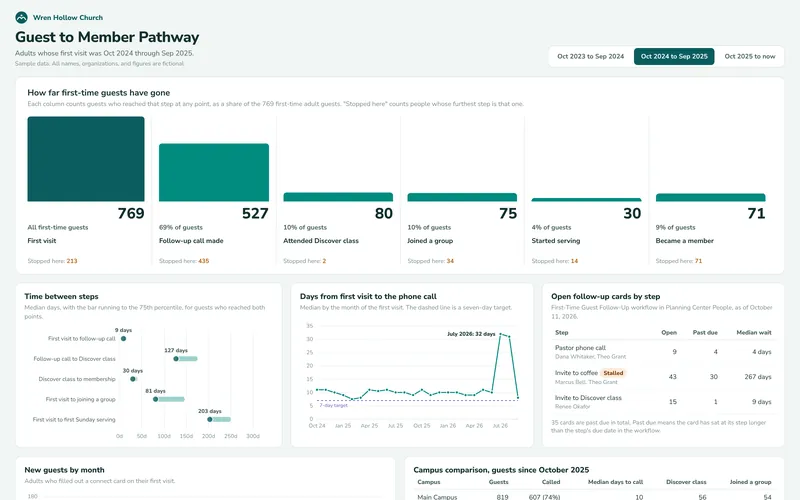
A report that follows first-time guests from their first visit through the follow-up call, the membership class, a group, a serving team, and membership. It shows where people stop, how long each step takes, and which follow-up workflow steps have stalled.
Sample data
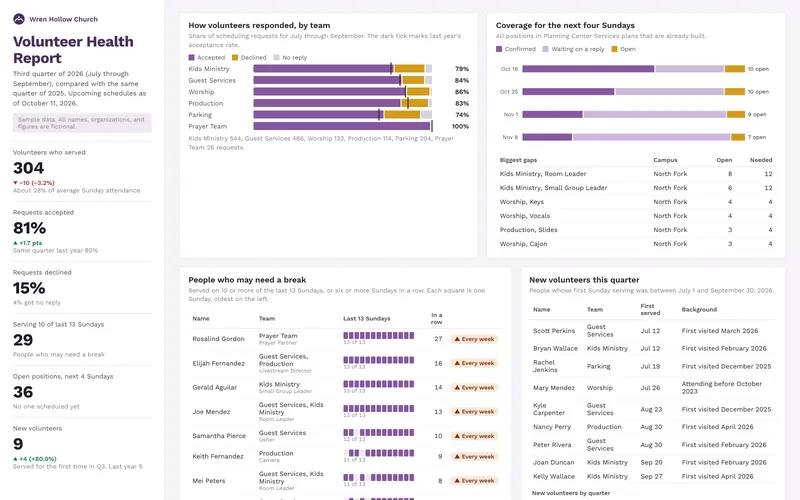
A quarterly report on Sunday volunteers built from Planning Center Services: accept and decline rates by team, people who have served too many weeks in a row, open positions for the coming Sundays, and new volunteers this quarter.
Sample data
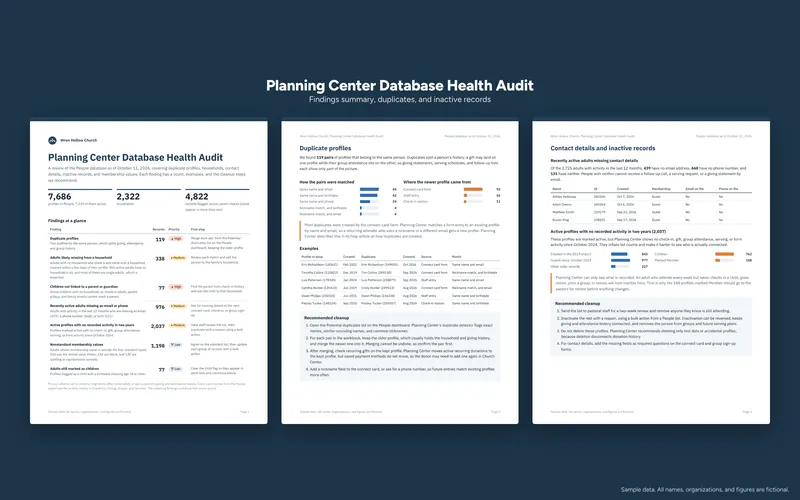
A sample audit of a church's Planning Center People database that counts duplicate profiles, people not in a household, children without a parent link, missing contact details, inactive records, and inconsistent membership values. It comes with a six-page report and an Excel workbook that lists every record and tracks cleanup.
Sample data
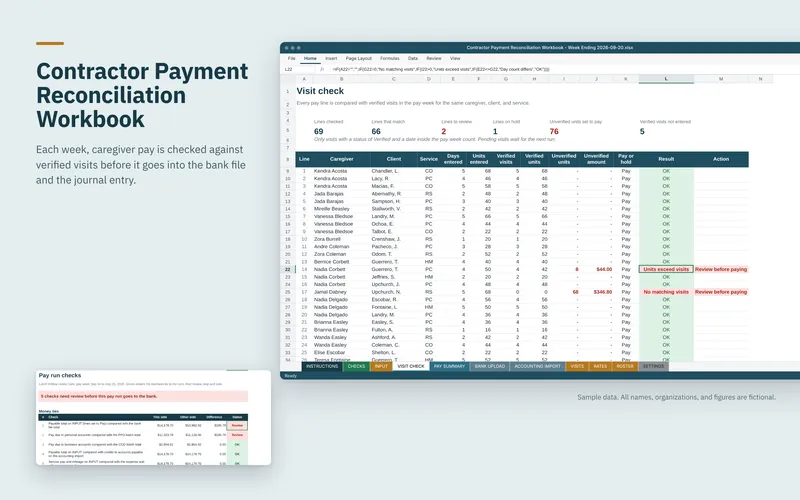
This Excel workbook is set up for a fictional in-home care agency that pays about 45 independent caregivers every week. It checks every pay line against verified visits, builds one bank file and one journal entry, and ties all three totals to the cent before money goes out.
Sample data
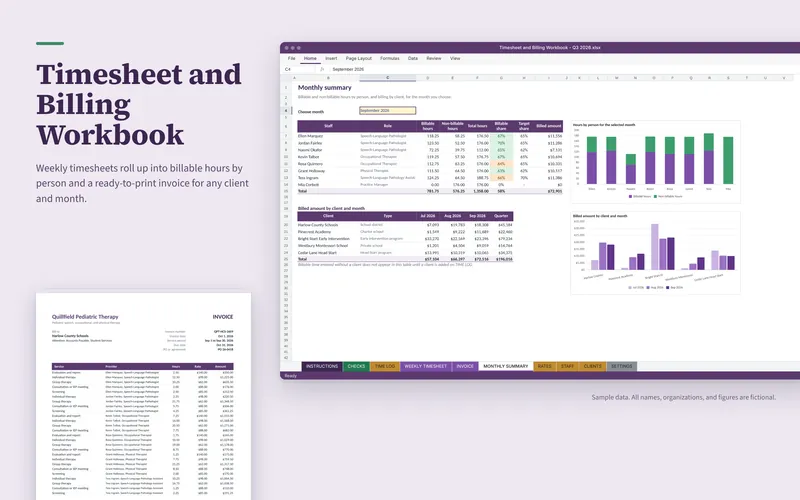
This Excel workbook is set up for a fictional pediatric therapy practice with eight staff. Staff log time by client and service code, and the workbook produces weekly timesheets, a monthly billable-hours summary with charts, and an invoice for any client and month.
Sample data
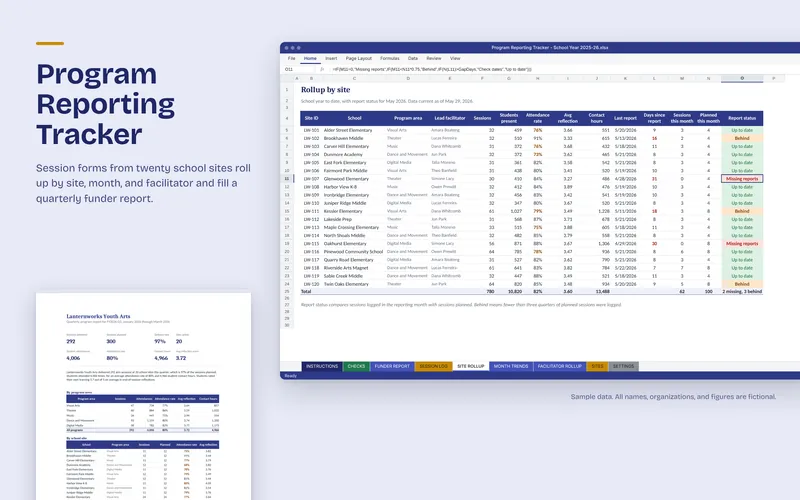
This Excel tracker is set up for a fictional youth arts nonprofit that runs programs at twenty school sites. Session form responses roll up by site, month, and facilitator, sites that have not reported are flagged, and a funder report fills itself for the quarter chosen.
Sample data
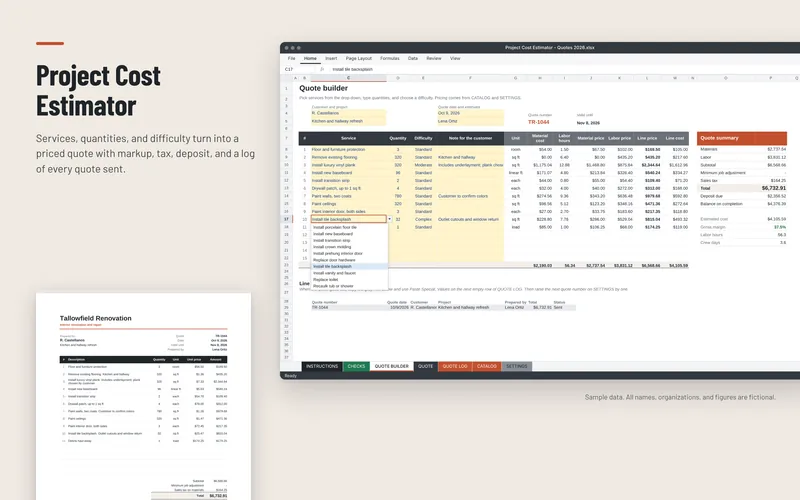
This Excel estimator is set up for a fictional renovation contractor. Services and quantities picked from drop-downs become a priced, printable quote with markup, tax, and deposit, and a quote log tracks every quote sent and which ones need a follow-up call.
Sample data