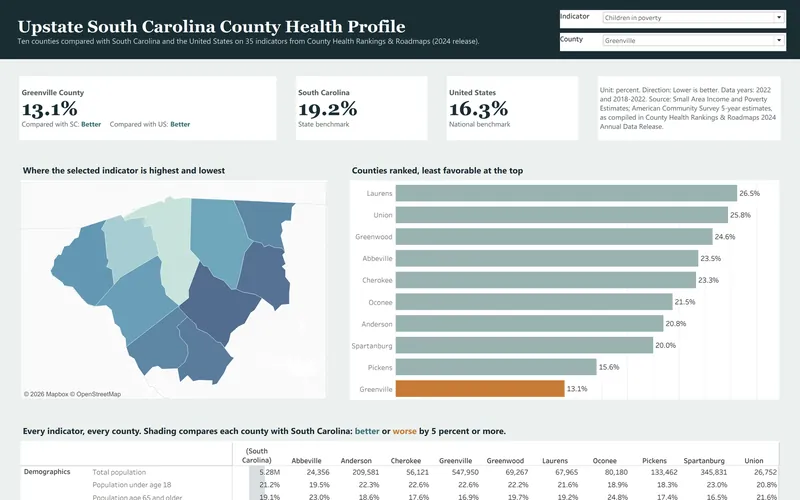
This is the secondary data profile from a community health needs assessment for ten Upstate South Carolina counties, and it is built from the 2024 County Health Rankings release. It compares 35 county indicators with state and national values and turns them into a dashboard, a 14-page report and an Excel workbook.
Public data
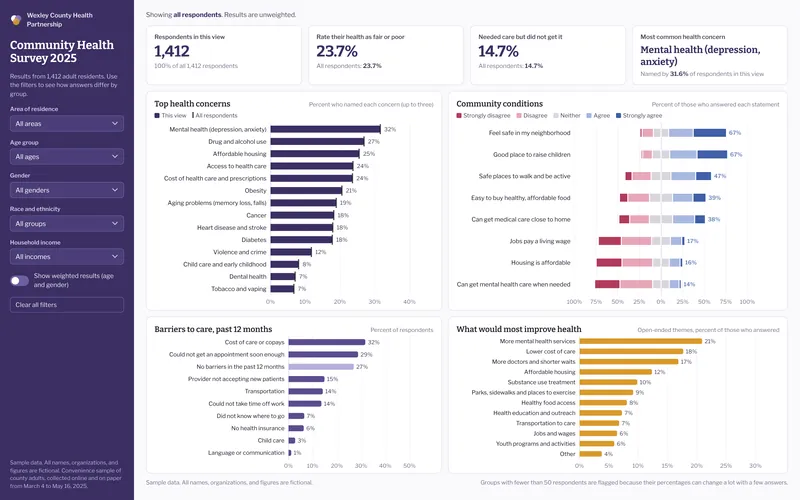
This sample analyzes a fictional county community health survey with 1,412 respondents, which is the kind of survey hospitals run as part of a community health needs assessment. It includes a filterable dashboard, an 8-page results brief and an Excel workbook with crosstabs, a codebook and weighting.
Sample data
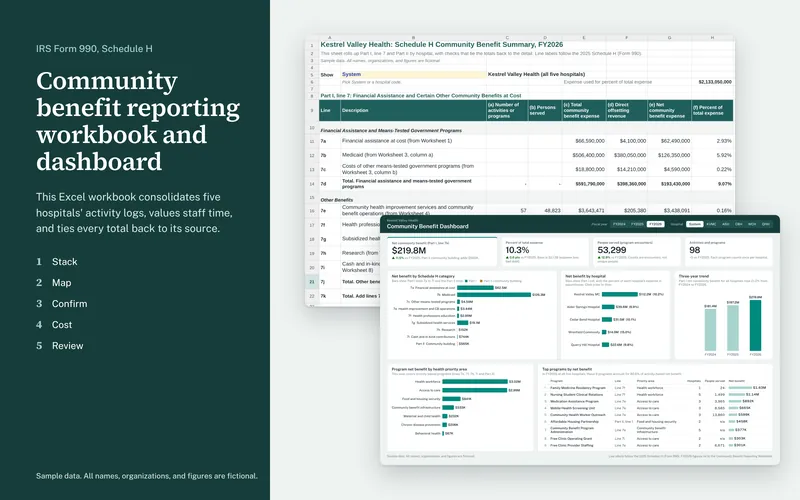
This Excel workbook consolidates five hospitals' community benefit activity logs into one dataset and rolls it up to the lines of IRS Form 990, Schedule H. Every total on the summary ties back through formulas to the row a hospital reported.
Sample data
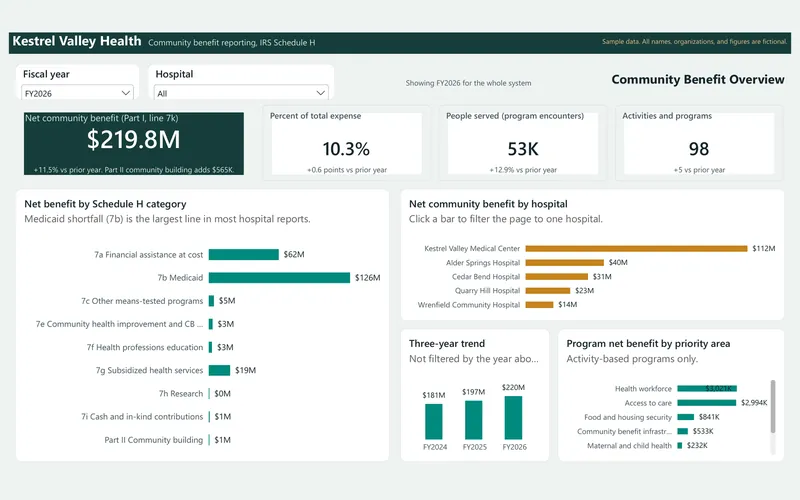
This interactive dashboard shows a hospital system's community benefit across three fiscal years, built from the same sample data as the reporting workbook. It comes with star-schema data files, a Power BI theme, and a rebuild guide with every DAX measure.
Sample data
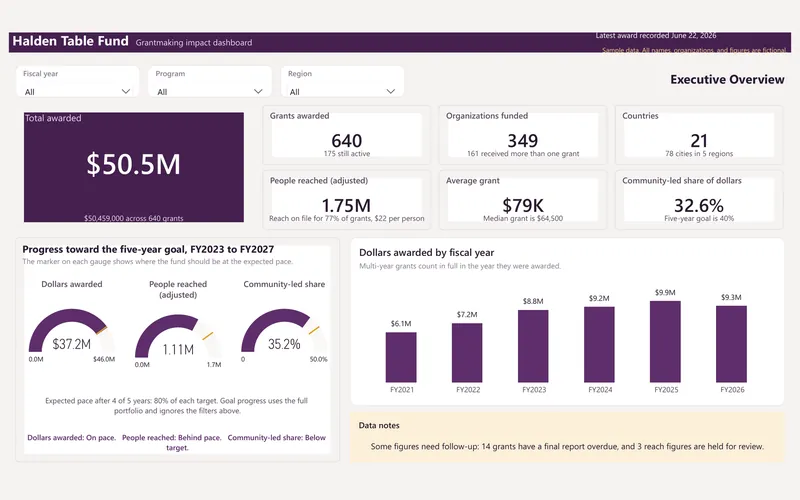
This is an executive dashboard for a corporate foundation's global grant program, covering six fiscal years, 640 grants, and $50.5 million in awards. It shows where the money went, who it reached, and how the fund is tracking against its five-year goal.
Sample data