Church Operations and Planning Center

Giving Analytics Dashboard

A four-page giving dashboard for a church finance team: giving units, recurring share, first-time and lapsed givers, giving bands, fund mix, monthly giving against budget, and a building campaign tracker. It comes with a Power BI rebuild kit that includes the data tables, a theme file, and every DAX measure.

Sample data. All names, organizations, and figures are fictional.

Giving Analytics Dashboard: Powerbi overview pco giving analyticsOpen larger image

About this sample

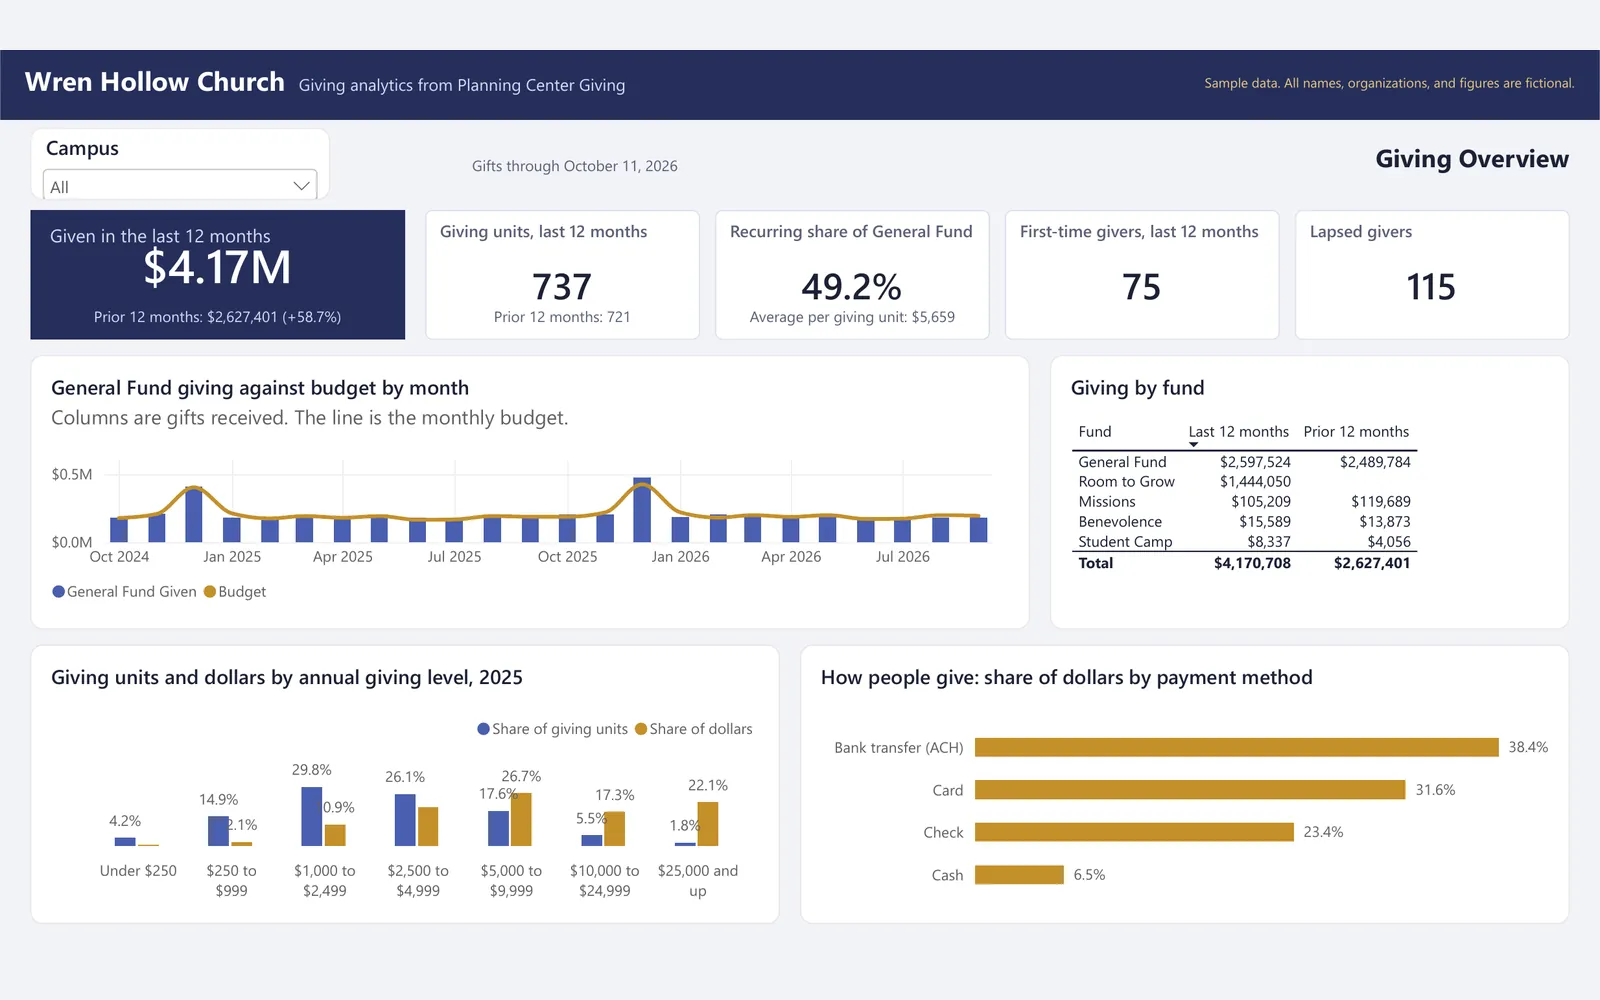
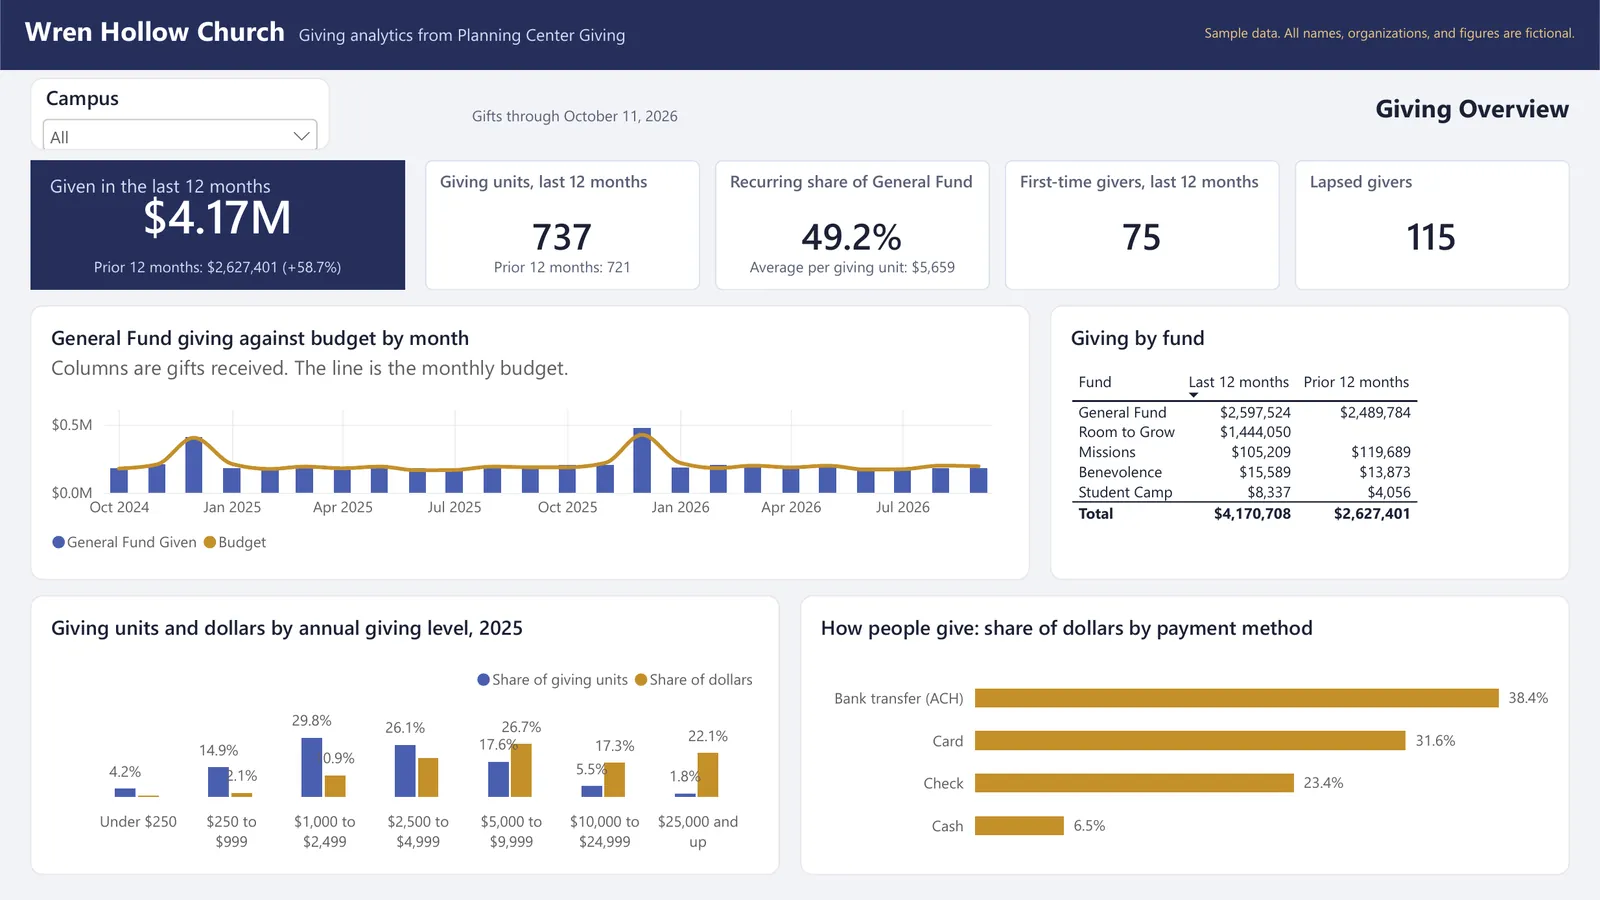
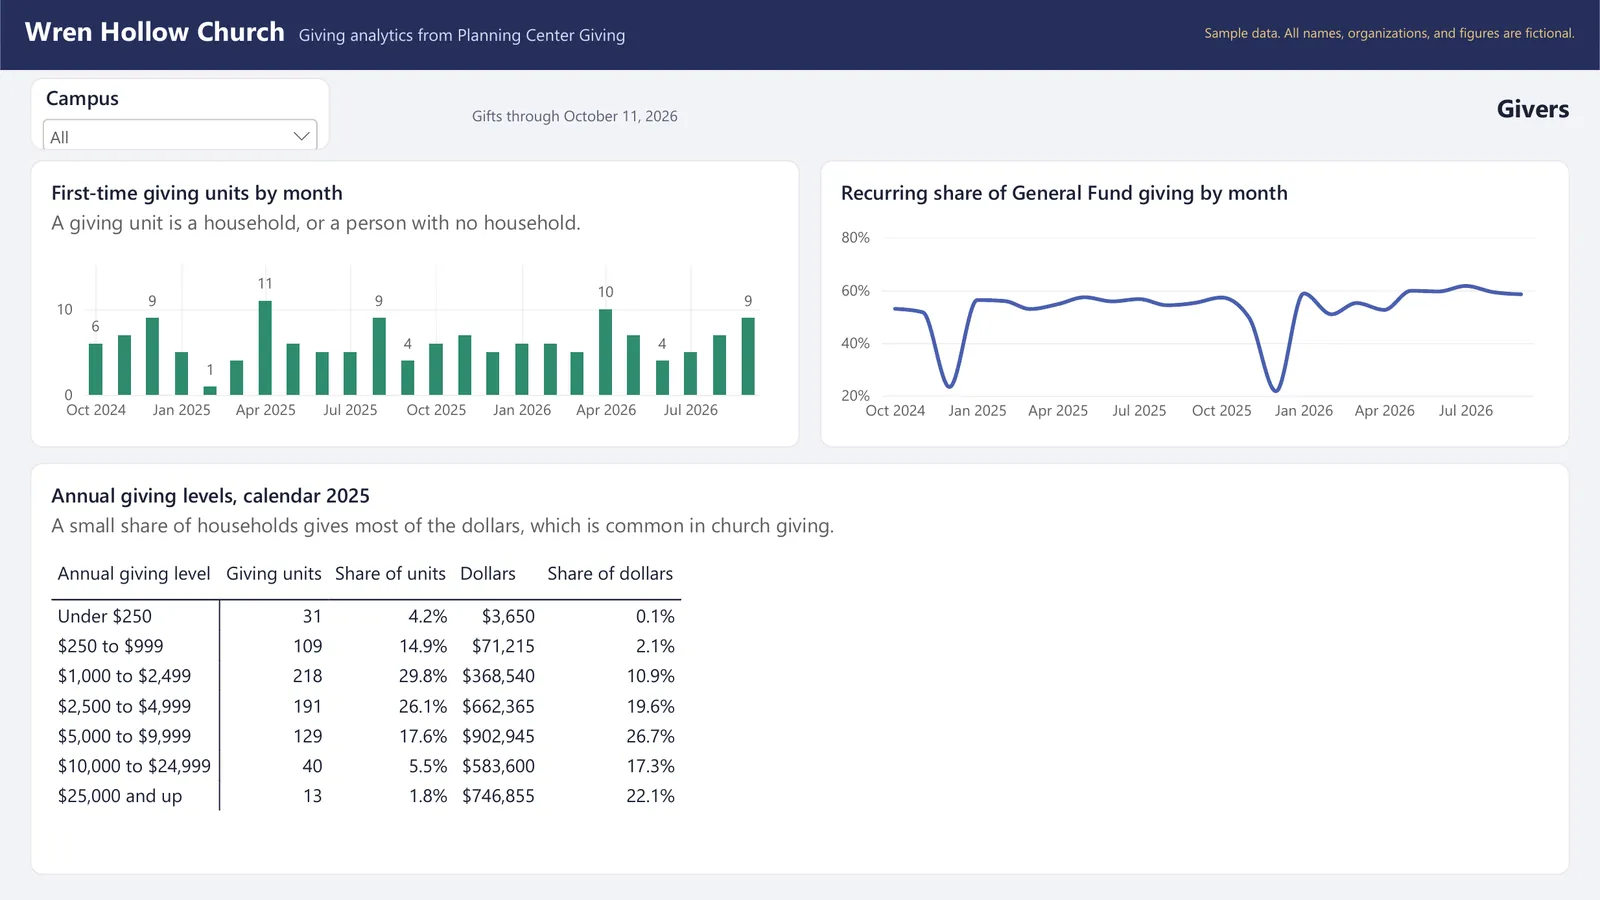
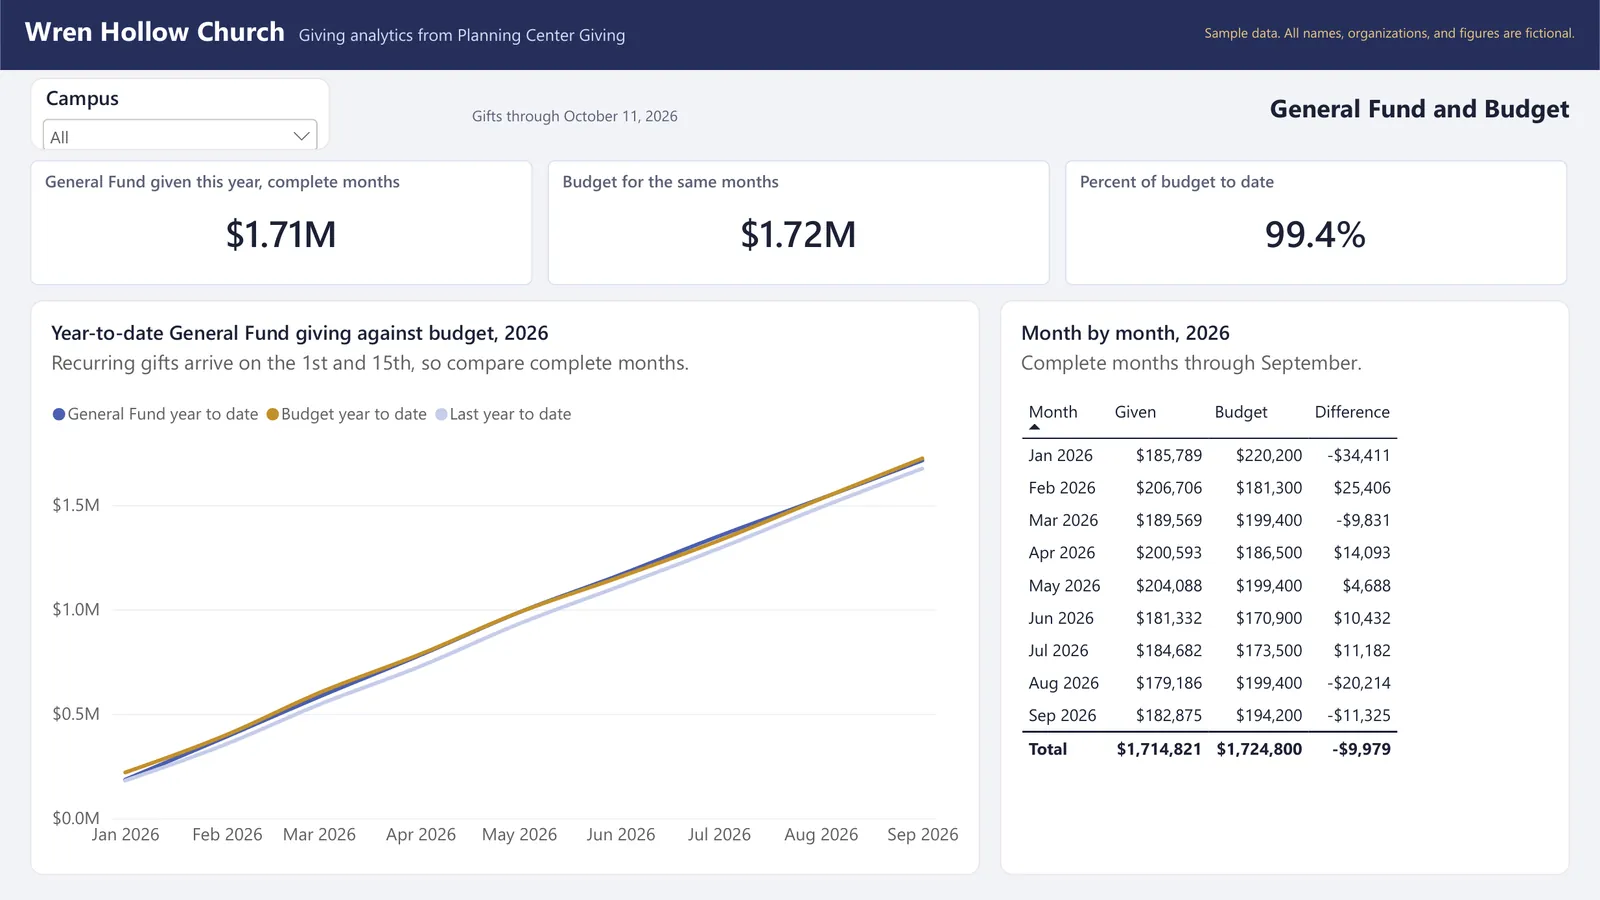
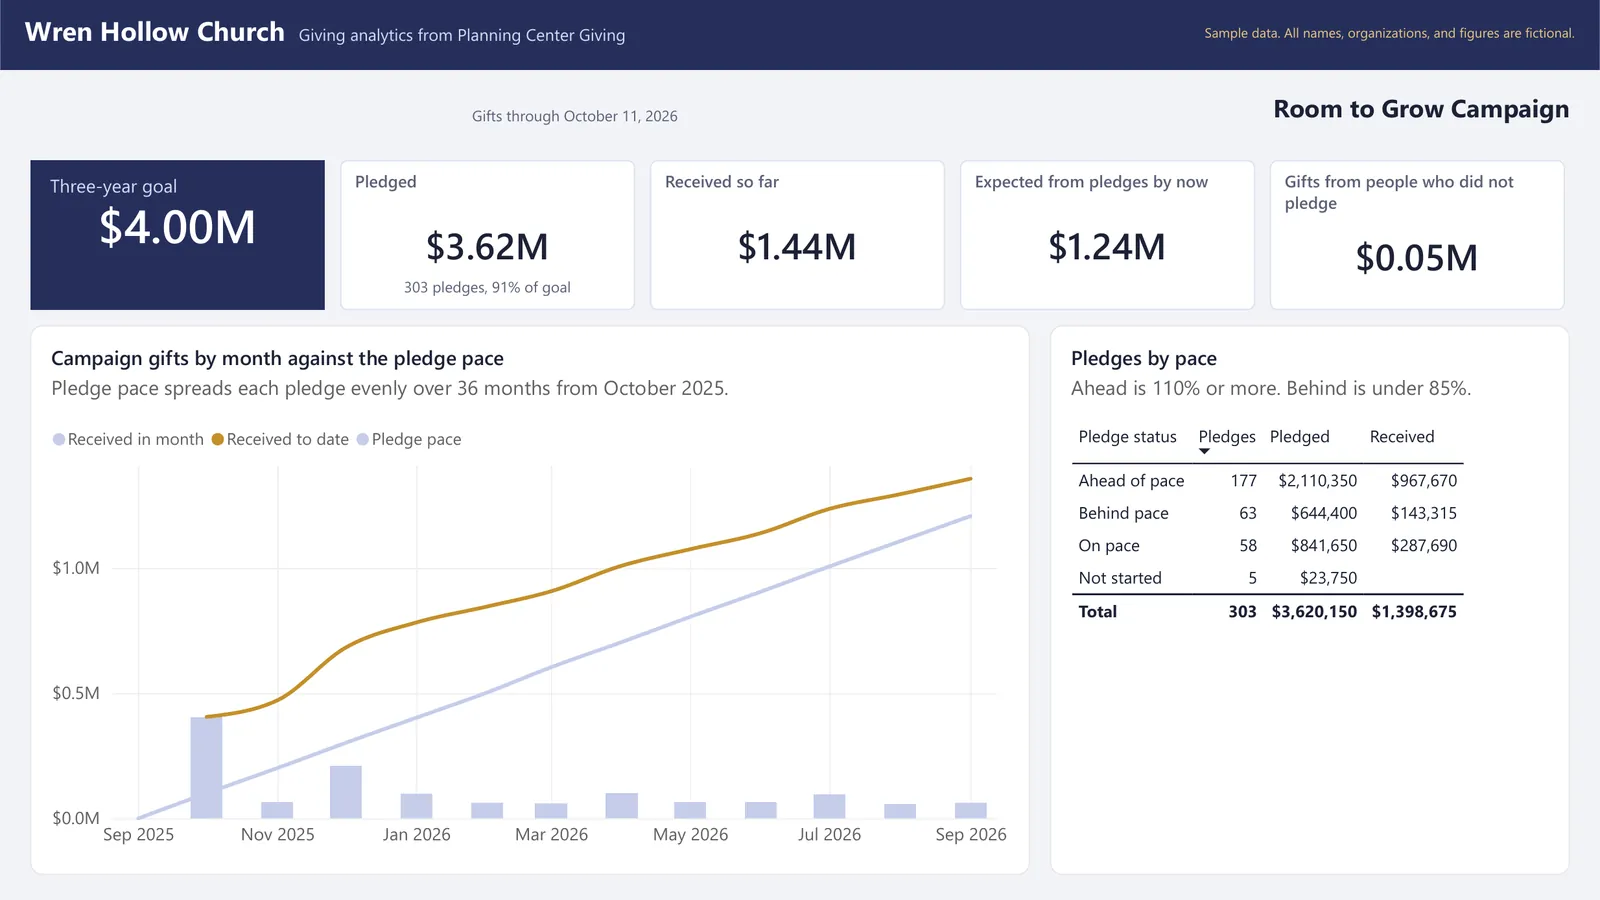
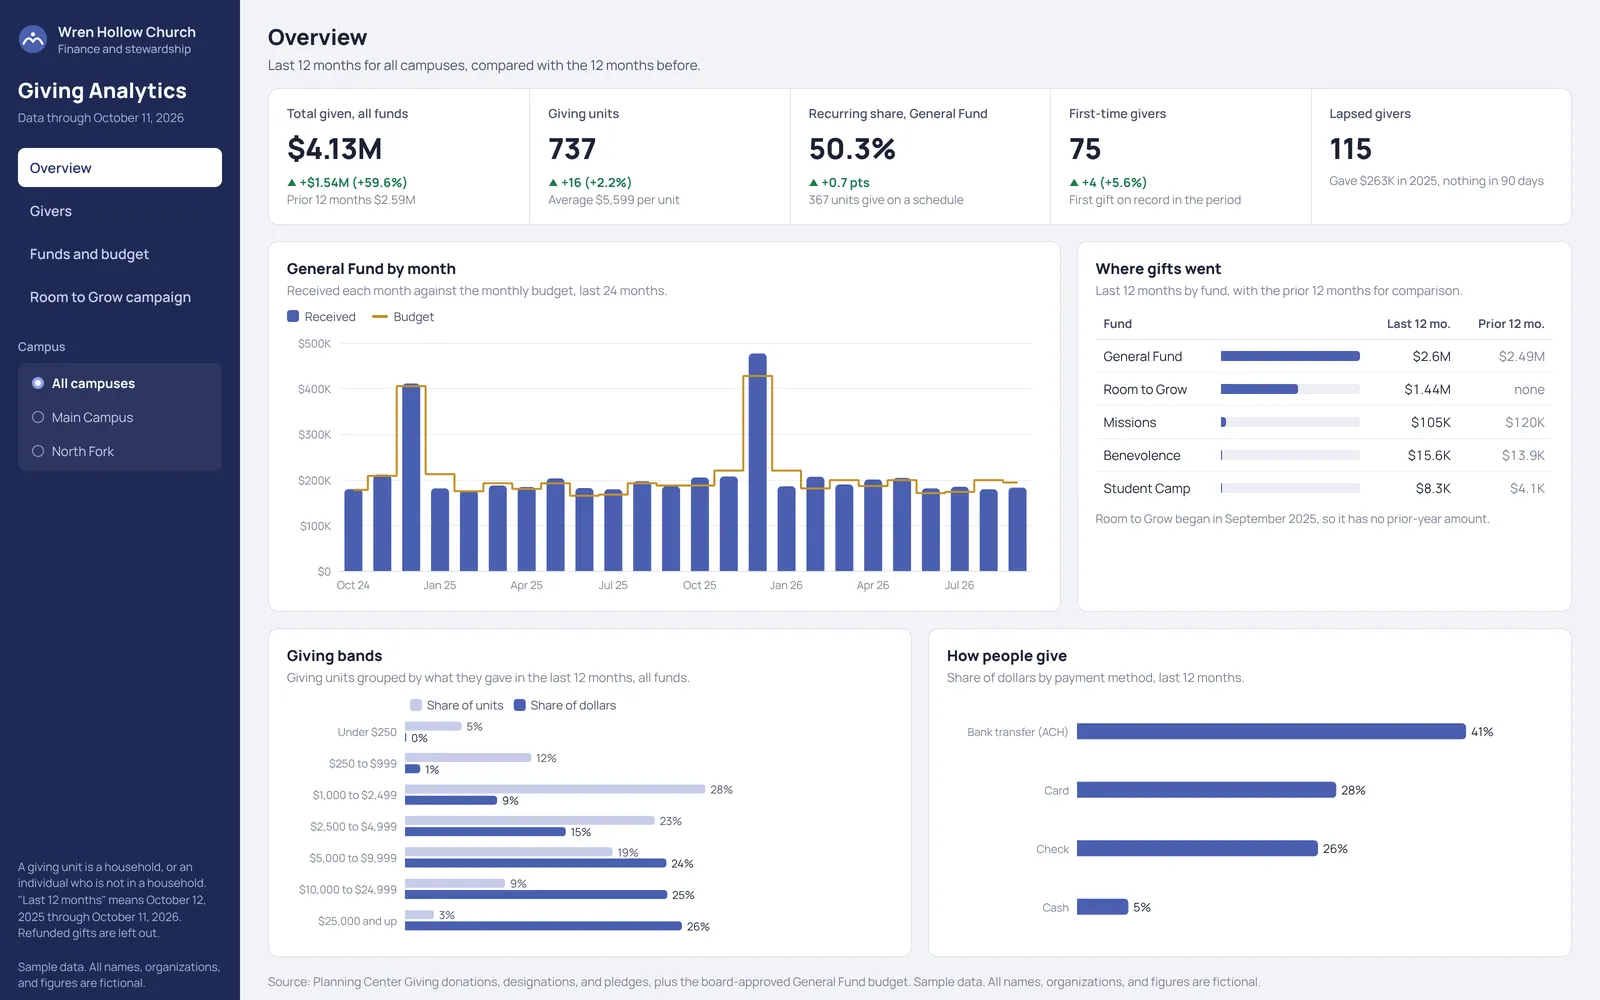
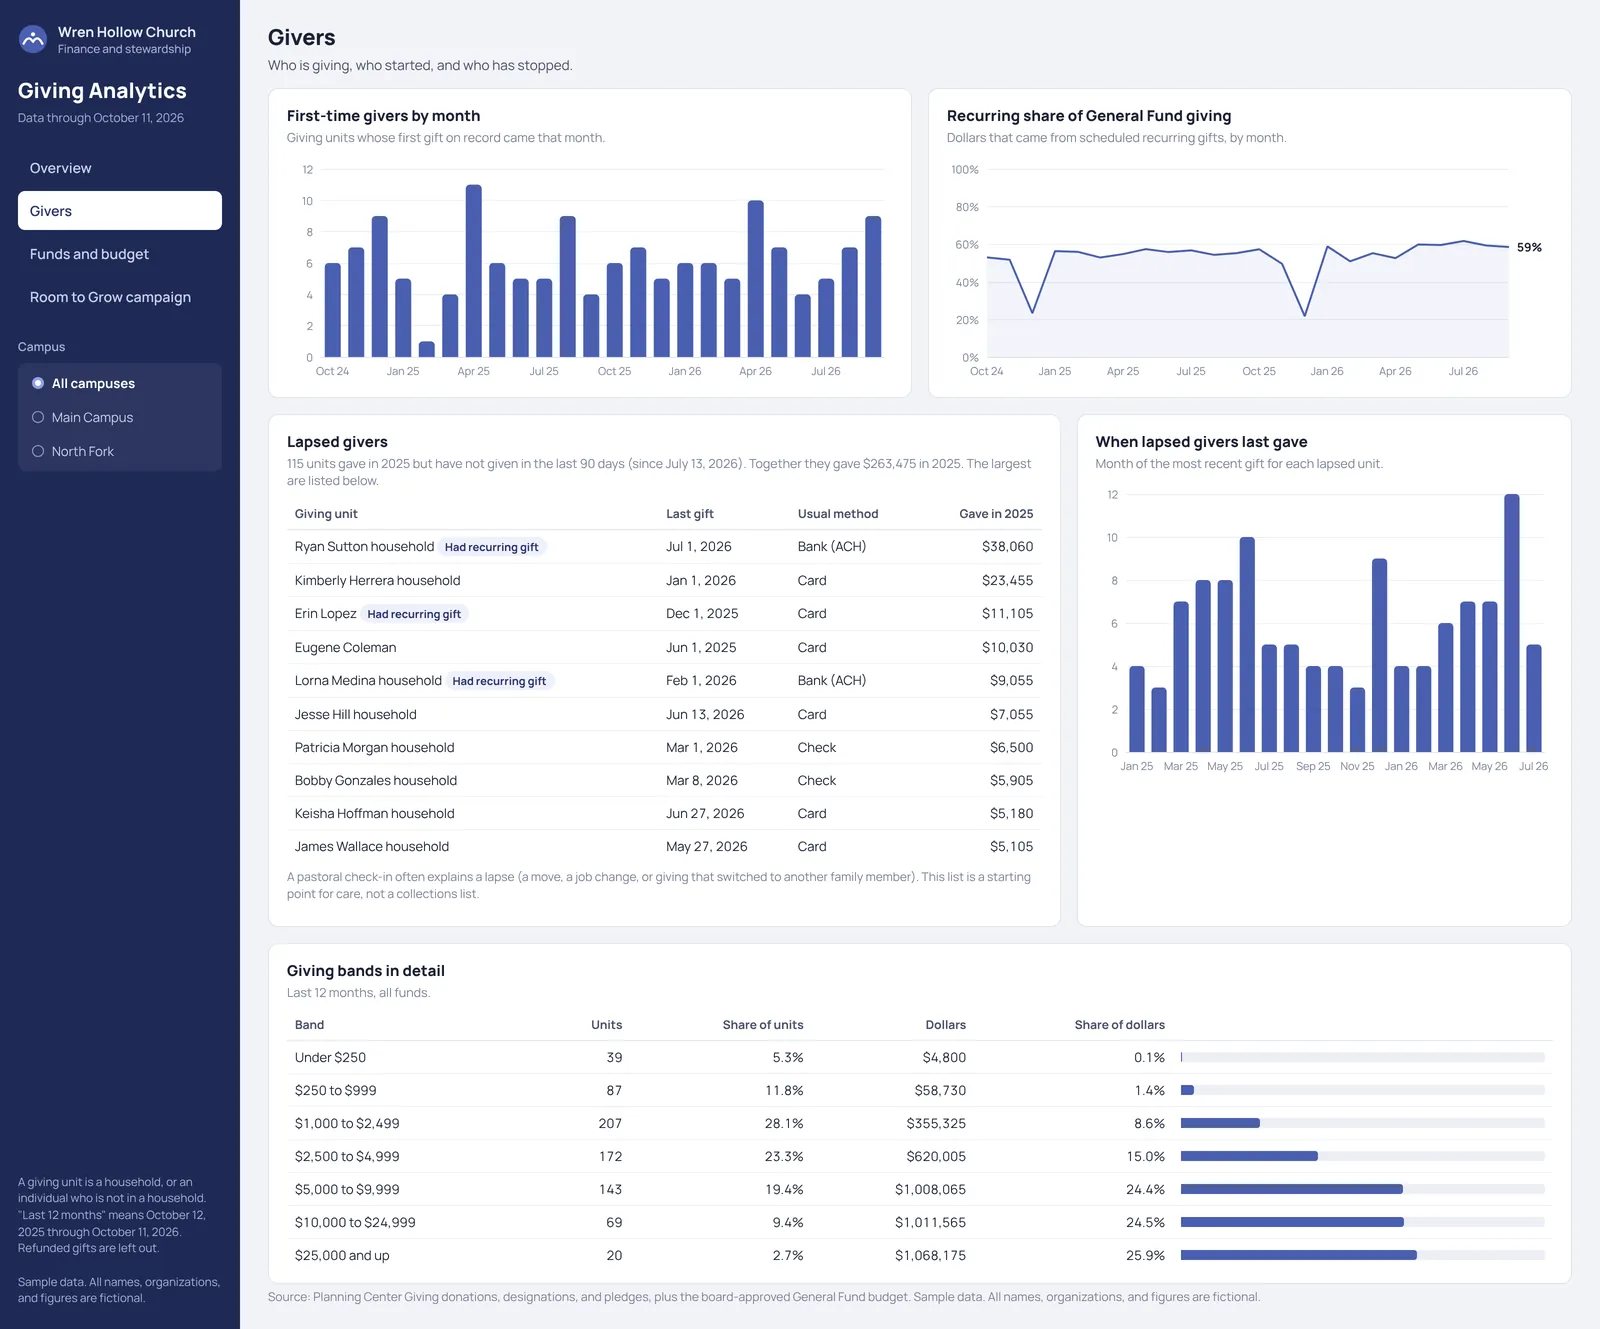
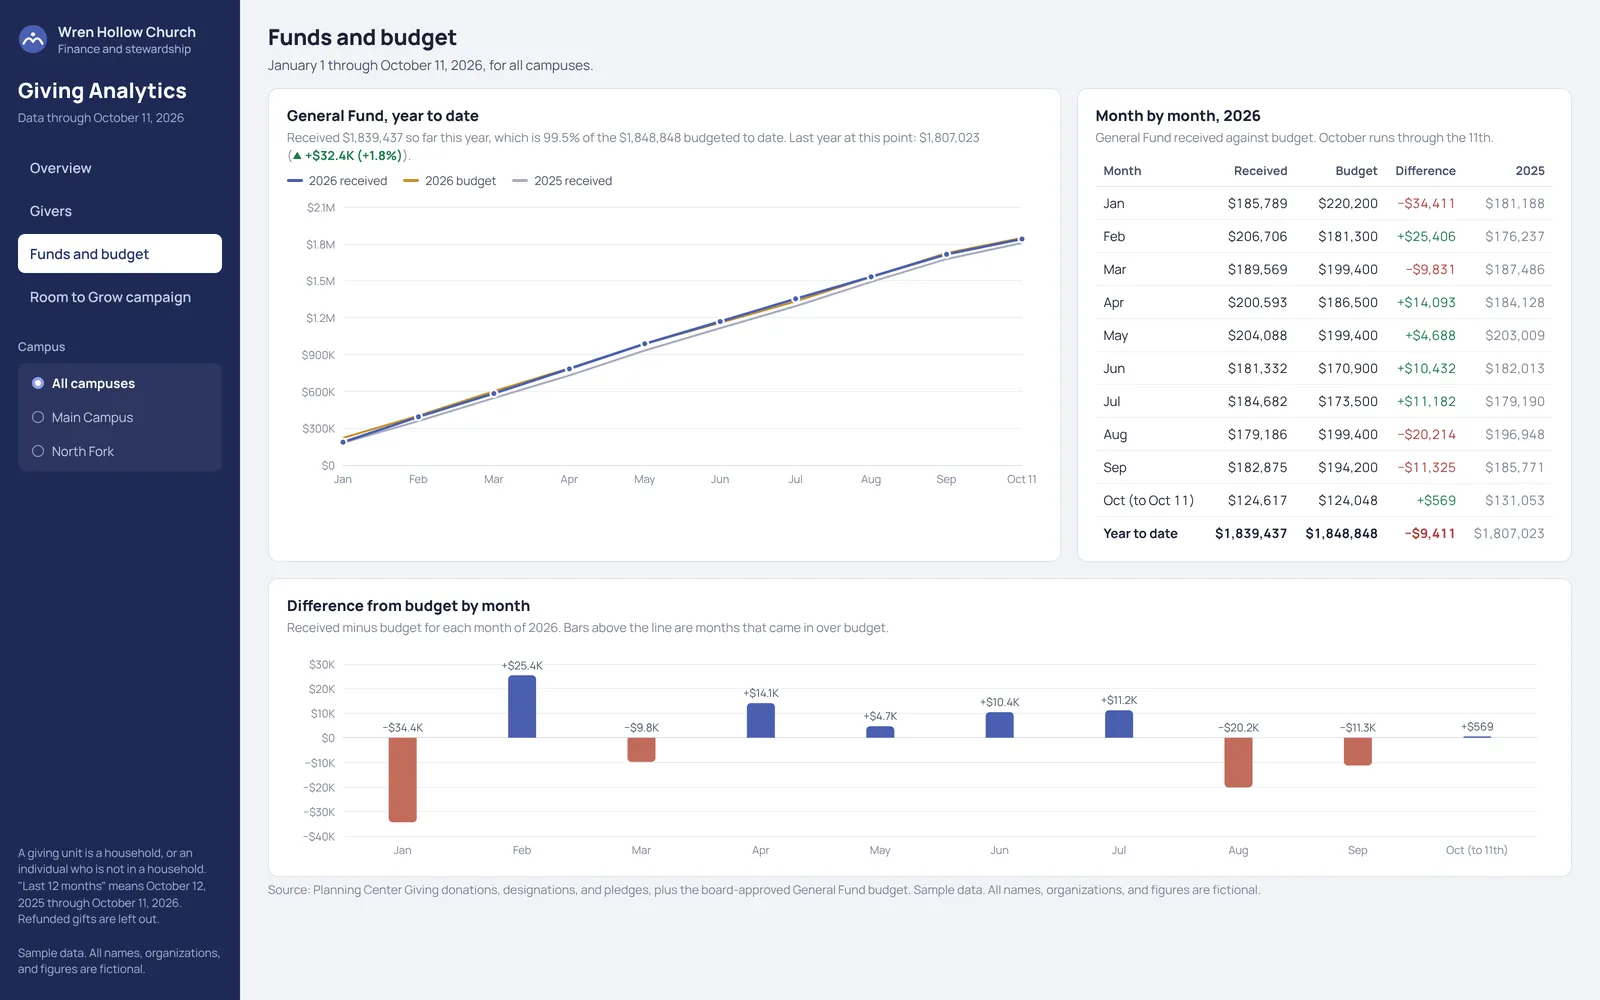
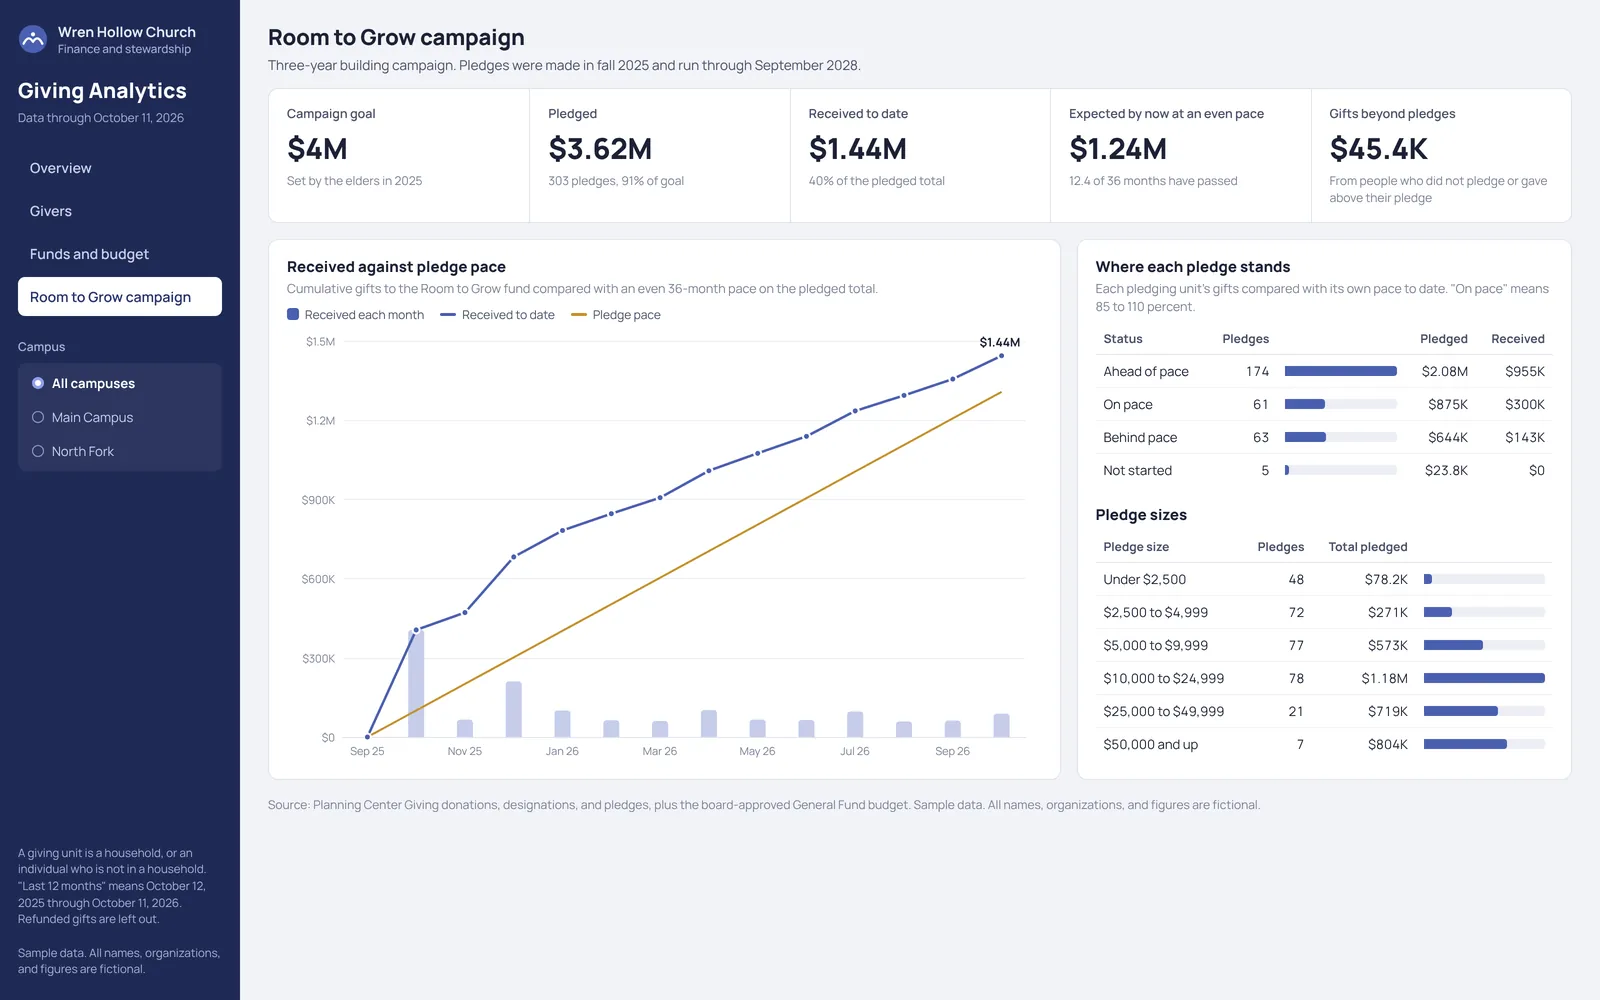
The dashboard answers the questions a finance committee and executive pastor ask about giving that Planning Center's donor reports do not combine in one place. The Overview page shows the last 12 months against the 12 before, with General Fund giving by month against the budget. The Givers page lists lapsed givers (gave last year, nothing in 90 days) as a starting point for pastoral care, along with first-time givers and giving bands. The Funds and budget page tracks year-to-date giving against budget and last year. The Room to Grow page compares building campaign gifts with an even pledge pace and shows where each pledge stands.

A campus filter applies to every page. The Power BI rebuild kit includes the data tables in Excel and CSV, a report theme, the relationships, and all DAX measures, so the same report can be rebuilt in Power BI Desktop in under an hour.

What it includes

  • A working Power BI report with five pages, a campus slicer, and 44 DAX measures, built in Power BI Desktop.
  • Giving units, average gift per unit, and recurring share against the prior 12 months
  • Lapsed givers list and month of last gift
  • First-time givers by month and giving bands by share of units and dollars
  • General Fund by month against budget, with year-to-date and variance
  • Building campaign received against pledge pace, with pledge status
  • Campus filter across all four pages
  • Power BI rebuild guide with every DAX measure and a theme JSON

Screenshots

Select an image to see it larger.

More in Church Operations and Planning Center

Weekly Leadership Snapshot

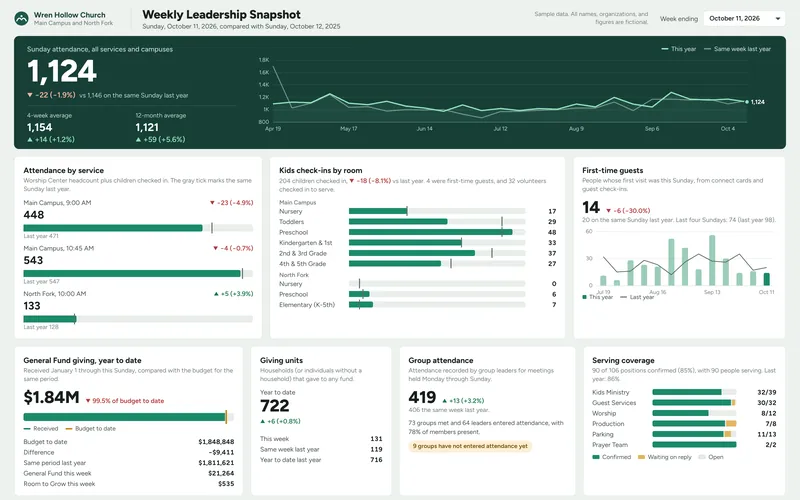
A one-page weekly dashboard for a senior pastor and staff that compares Sunday with the same Sunday last year. It brings attendance, kids check-ins, first-time guests, giving against budget, groups, and serving coverage from Planning Center into one view.

  • Power BI
  • PDF report

Sample data

Guest to Member Pathway Report

A report that follows first-time guests from their first visit through the follow-up call, the membership class, a group, a serving team, and membership. It shows where people stop, how long each step takes, and which follow-up workflow steps have stalled.

  • Power BI
  • PDF report

Sample data