Church Operations and Planning Center

Volunteer Health Report

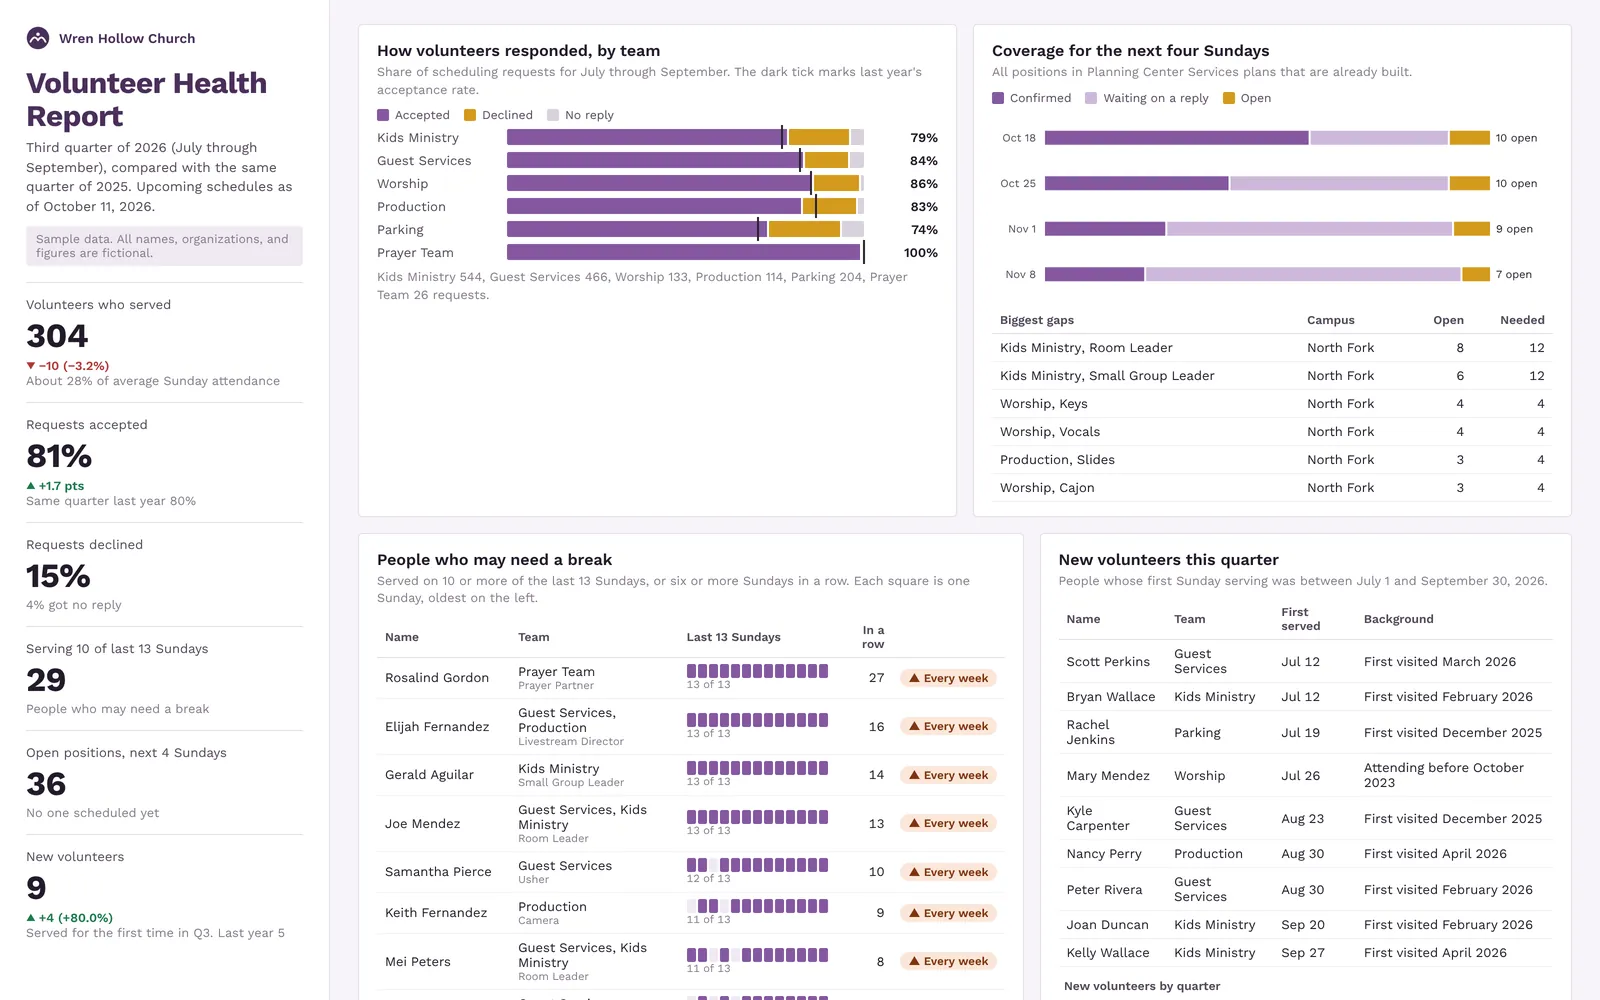
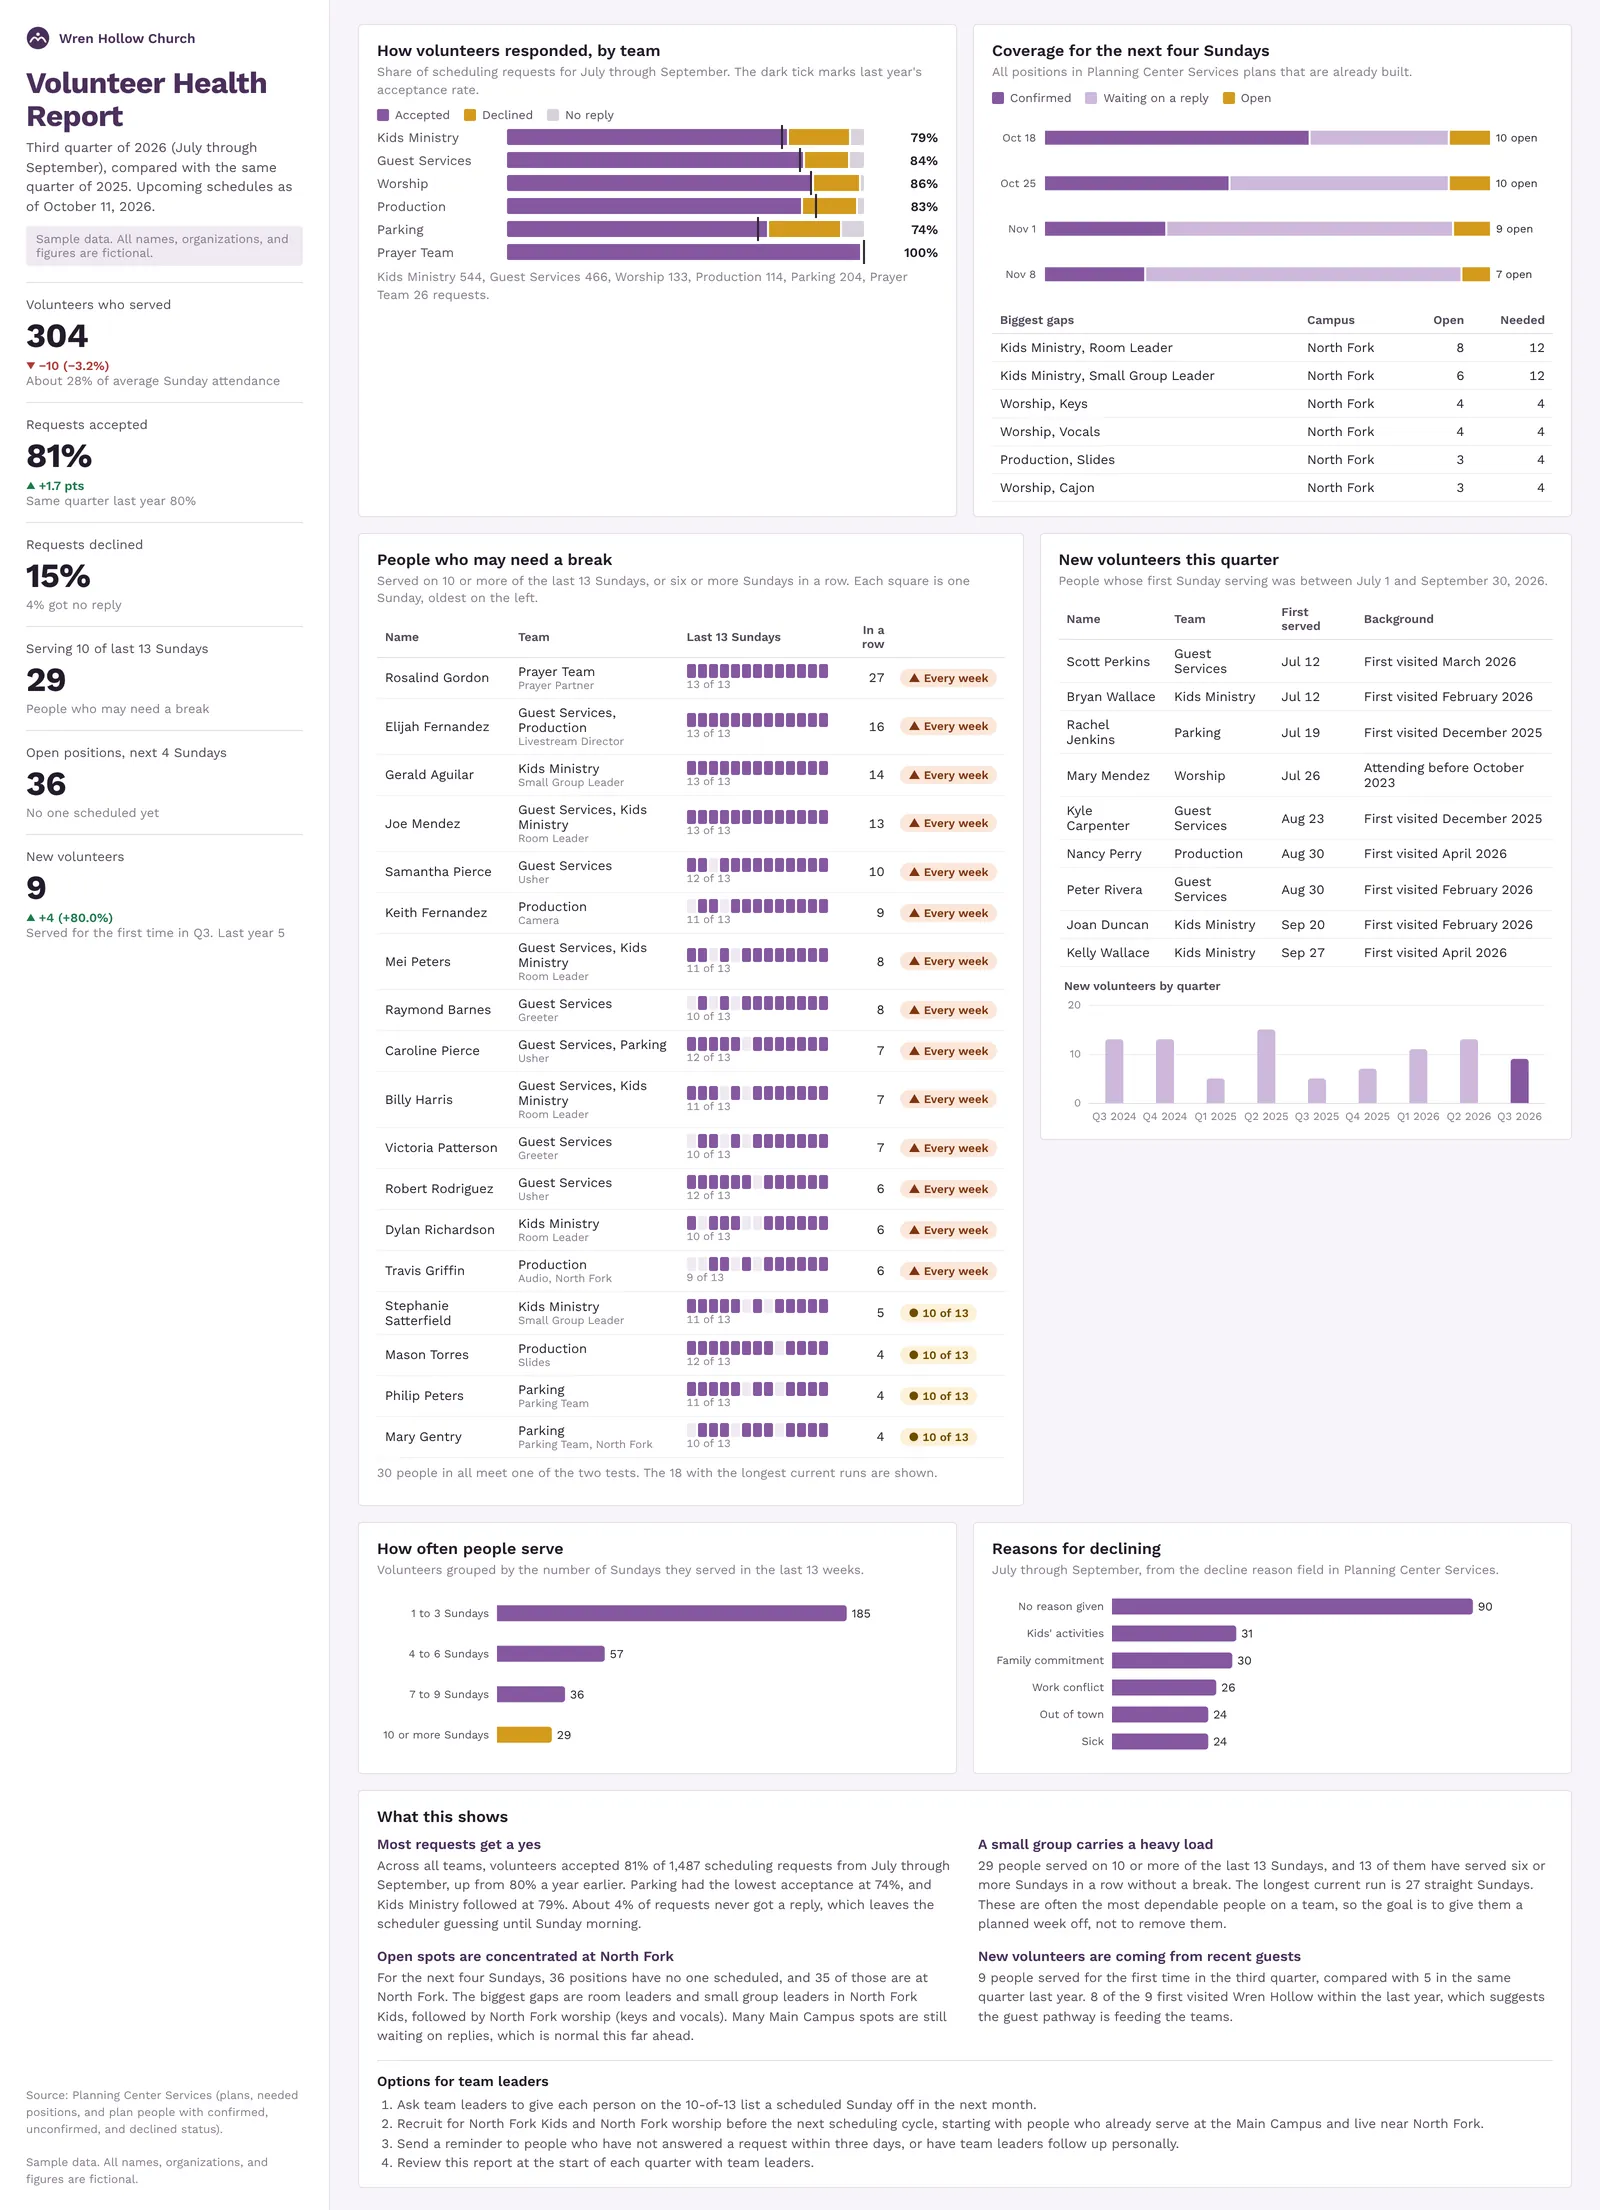
A quarterly report on Sunday volunteers built from Planning Center Services: accept and decline rates by team, people who have served too many weeks in a row, open positions for the coming Sundays, and new volunteers this quarter.

Sample data. All names, organizations, and figures are fictional.

Volunteer Health Report: Volunteer Health: DashboardOpen larger image

About this sample

Planning Center Services shows who is scheduled for a given Sunday, but it is harder to see patterns across a quarter. This report compares each team's acceptance rate with last year, lists the people who have served on 10 or more of the last 13 Sundays (with a square for each Sunday so the run is easy to see), and counts open and unanswered positions for the next four Sundays by team and campus.

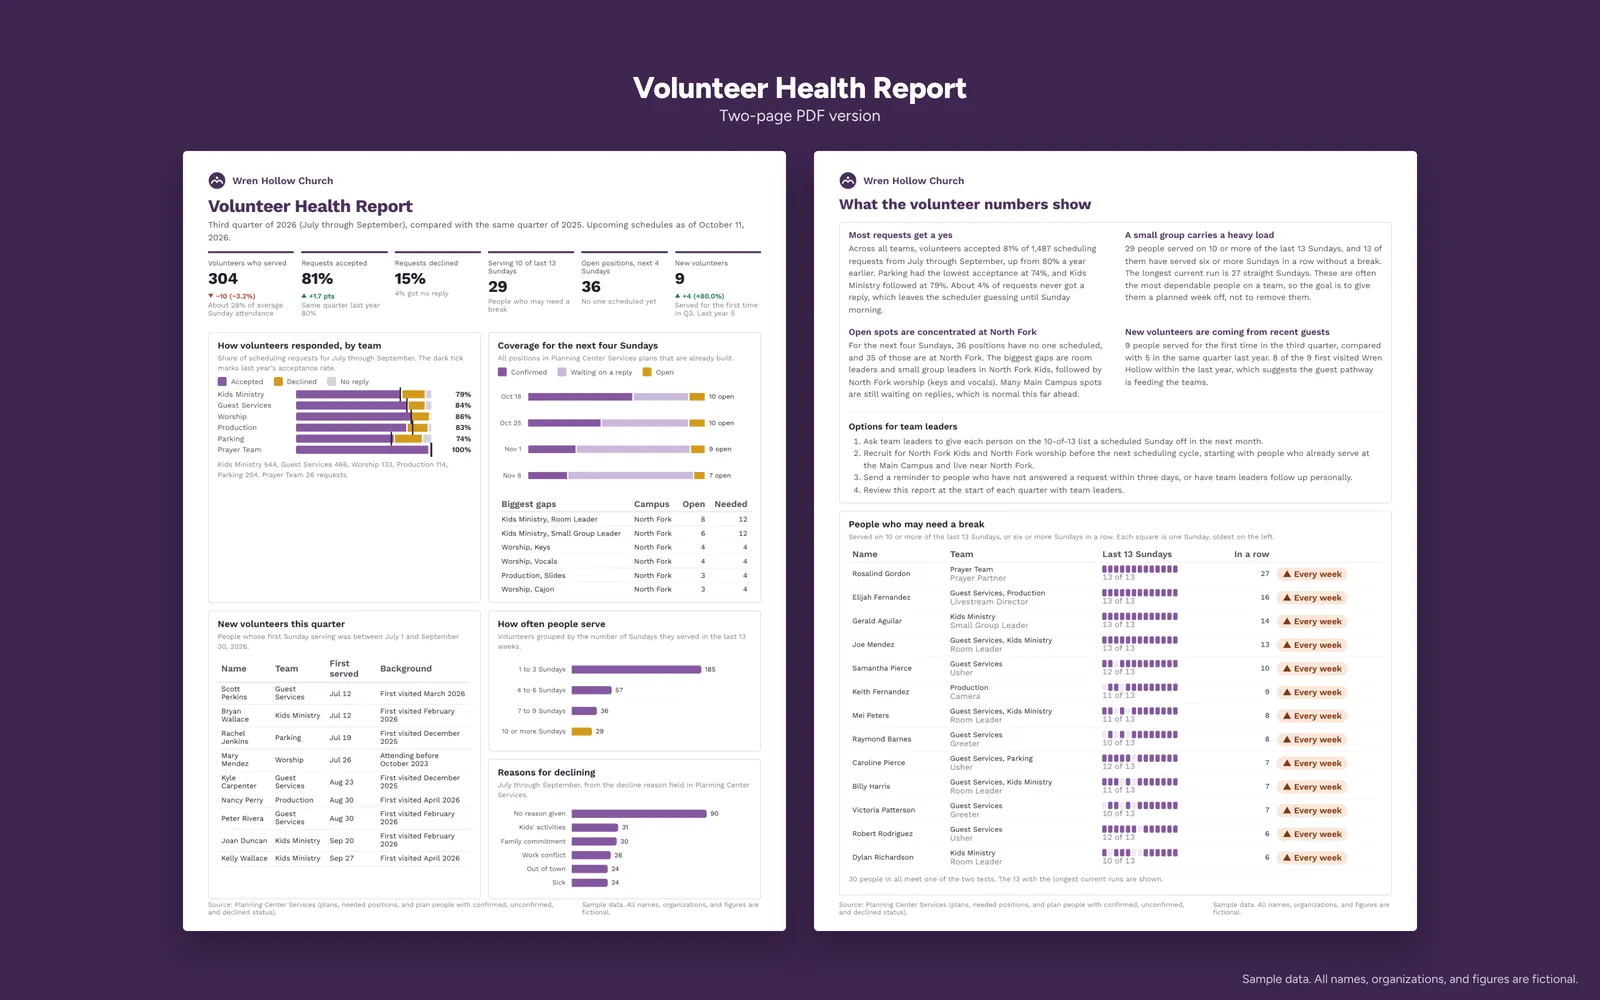
It also lists first-time volunteers and how they came to the church, the decline reasons people gave, and how often people serve. The PDF version includes short notes and options for team leaders.

What it includes

  • Accepted, declined, and no-reply rates by team against last year
  • People who may need a break, with a 13-Sunday serving pattern
  • Coverage for the next four Sundays: confirmed, waiting, and open
  • Biggest open positions by team and campus
  • New volunteers this quarter and by quarter
  • Decline reasons and serving frequency
  • Two-page PDF with notes for team leaders
  • Power BI rebuild guide with the key DAX measures

Screenshots

Select an image to see it larger.

More in Church Operations and Planning Center

Weekly Leadership Snapshot

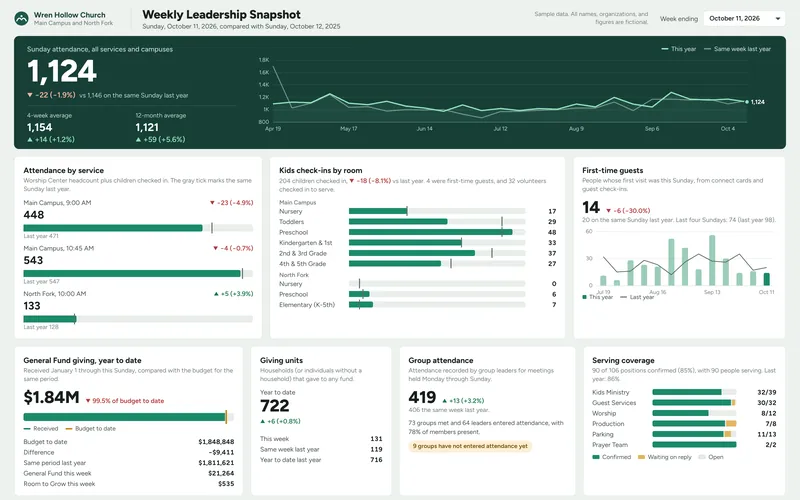
A one-page weekly dashboard for a senior pastor and staff that compares Sunday with the same Sunday last year. It brings attendance, kids check-ins, first-time guests, giving against budget, groups, and serving coverage from Planning Center into one view.

  • Power BI
  • PDF report

Sample data

Giving Analytics Dashboard

A four-page giving dashboard for a church finance team: giving units, recurring share, first-time and lapsed givers, giving bands, fund mix, monthly giving against budget, and a building campaign tracker. It comes with a Power BI rebuild kit that includes the data tables, a theme file, and every DAX measure.

  • Power BI
  • Excel

Sample data