Church Operations and Planning Center

Weekly Leadership Snapshot

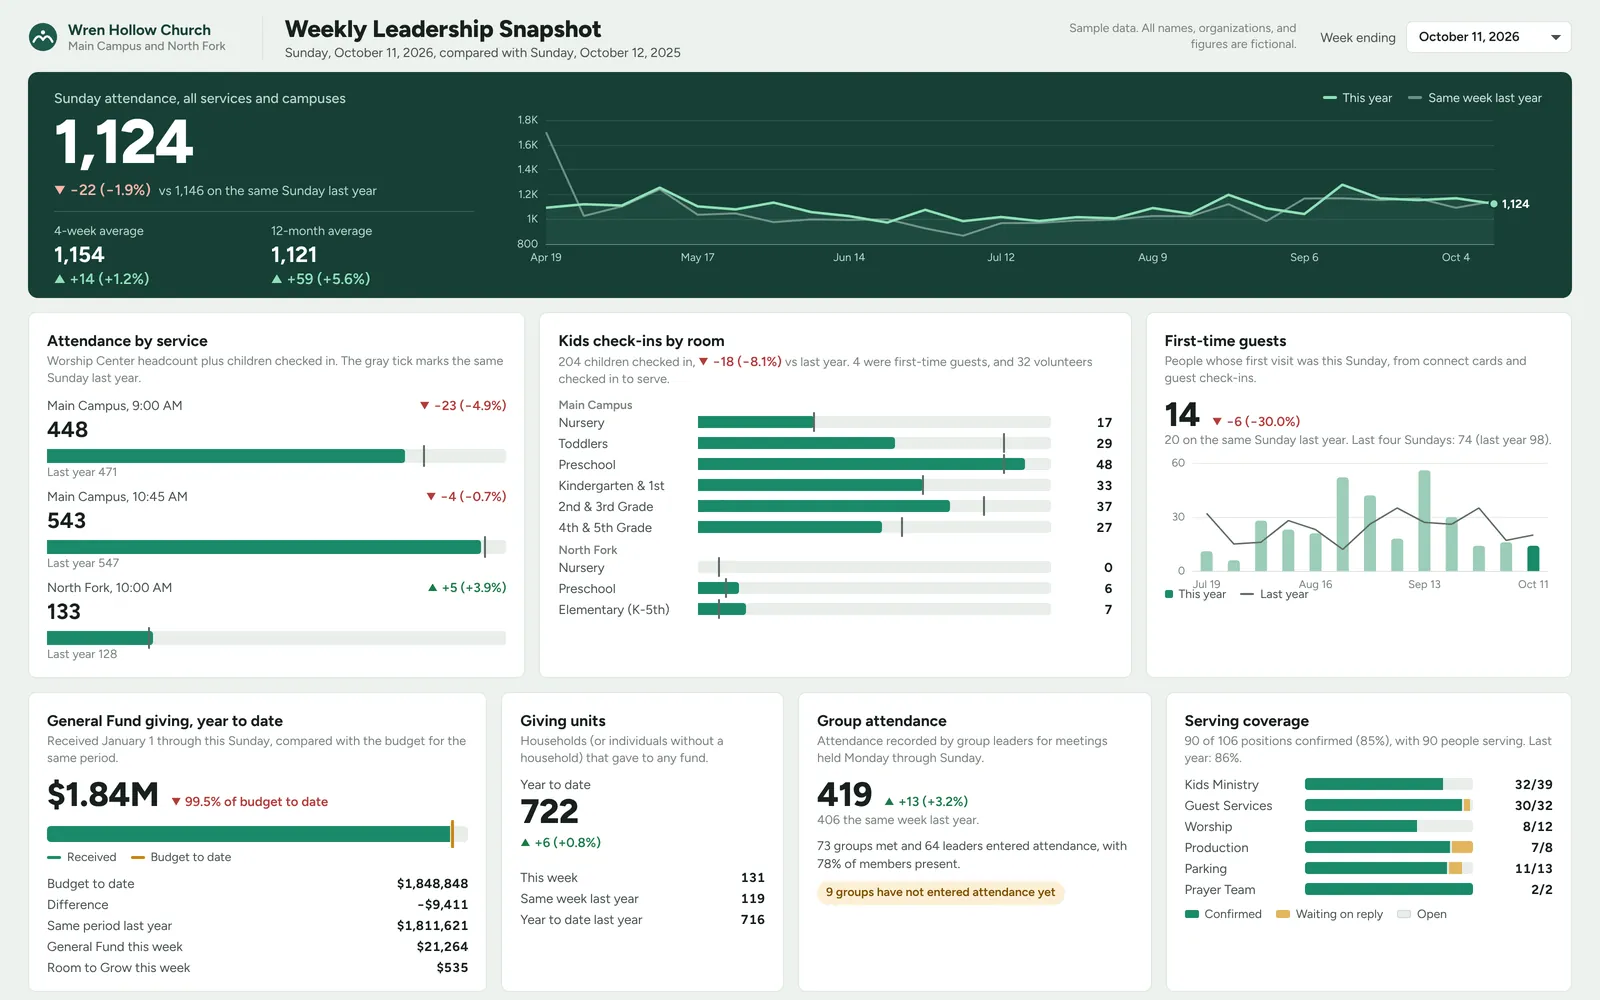
A one-page weekly dashboard for a senior pastor and staff that compares Sunday with the same Sunday last year. It brings attendance, kids check-ins, first-time guests, giving against budget, groups, and serving coverage from Planning Center into one view.

Sample data. All names, organizations, and figures are fictional.

Weekly Leadership Snapshot: Weekly Snapshot: DashboardOpen larger image

About this sample

Planning Center keeps attendance, giving, groups, and serving in separate apps, so a staff meeting usually starts with several reports. This snapshot puts them on one page for a fictional church of about 1,100 people with two Sunday services and a second campus. A reader can see attendance by service and campus with last year's number beside it, kids check-ins by room, first-time guests, General Fund giving against the budget to date, giving units, group attendance (including how many leaders have not entered attendance), and how many serving positions are filled by team.

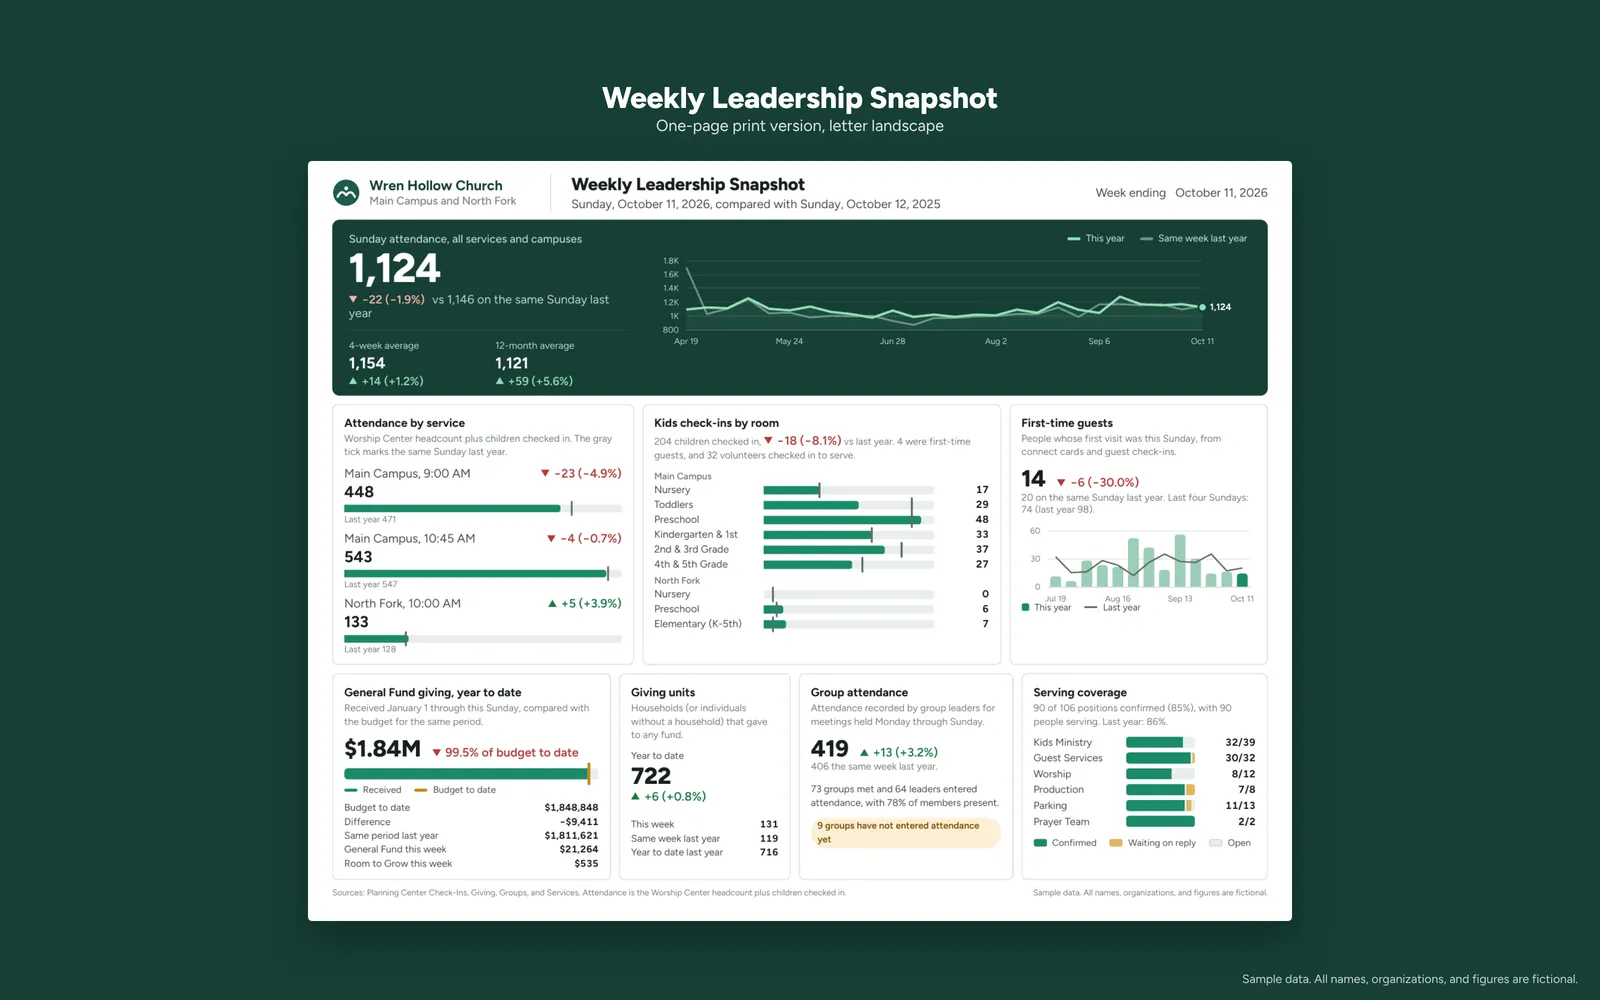
The interactive version lets staff pick any of the last eight Sundays, and the print version fits on one letter page for a staff meeting handout. The 4-week and 12-month averages sit next to the single Sunday so one unusual week does not drive the conversation.
What it includes

  • Sunday attendance against the same Sunday last year, plus 4-week and 12-month averages
  • Attendance by service and campus with last year's mark on each bar
  • Kids check-ins by room for both campuses
  • First-time guests with a 13-week trend
  • General Fund giving against budget to date and giving units
  • Group attendance with a flag for leaders who have not reported
  • Serving coverage by team: confirmed, waiting, and open
  • Week picker, one-page print version, and a Power BI rebuild guide with the key DAX measures

Screenshots

Select an image to see it larger.

More in Church Operations and Planning Center

Giving Analytics Dashboard

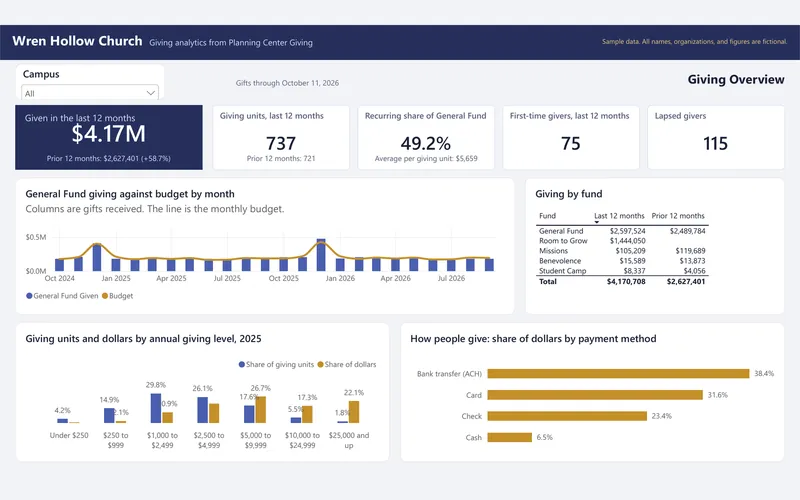
A four-page giving dashboard for a church finance team: giving units, recurring share, first-time and lapsed givers, giving bands, fund mix, monthly giving against budget, and a building campaign tracker. It comes with a Power BI rebuild kit that includes the data tables, a theme file, and every DAX measure.

  • Power BI
  • Excel

Sample data

Guest to Member Pathway Report

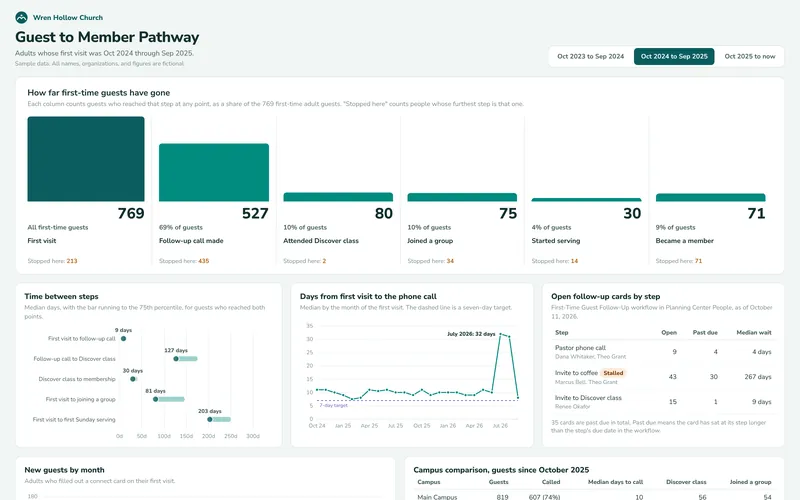
A report that follows first-time guests from their first visit through the follow-up call, the membership class, a group, a serving team, and membership. It shows where people stop, how long each step takes, and which follow-up workflow steps have stalled.

  • Power BI
  • PDF report

Sample data