Community Health and Hospital Community Benefit
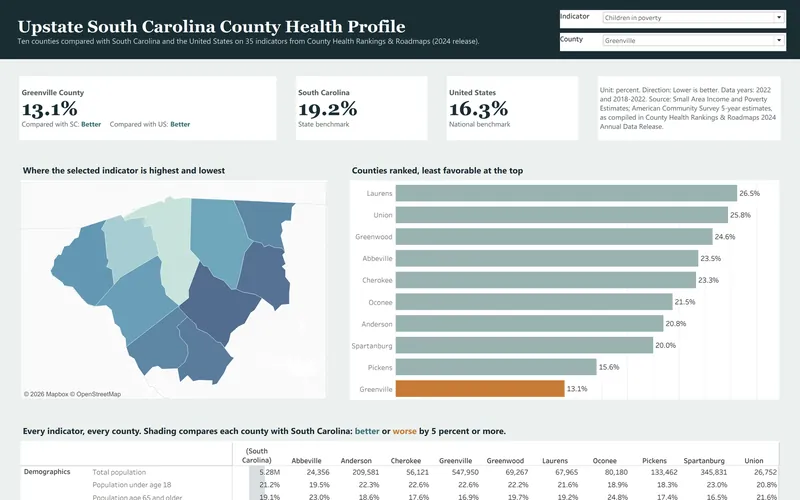
This is the secondary data profile from a community health needs assessment for ten Upstate South Carolina counties, and it is built from the 2024 County Health Rankings release. It compares 35 county indicators with state and national values and turns them into a dashboard, a 14-page report and an Excel workbook.
Public data
Public Sector and Human Services
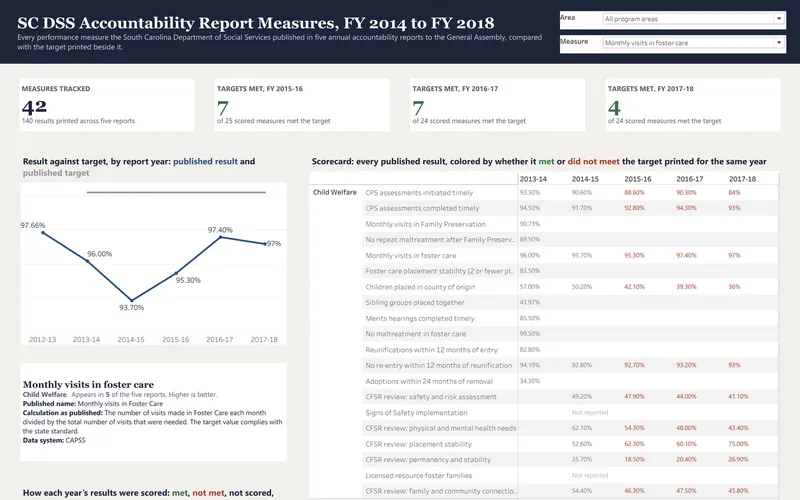
This dashboard and workbook pull every performance measure from five South Carolina Department of Social Services annual accountability reports into one table, link each measure across years, and compare each result with the target printed beside it. Brad prepared four of these reports as the agency's Director of Accountability, Data and Research.
Public data
Public Sector and Human Services
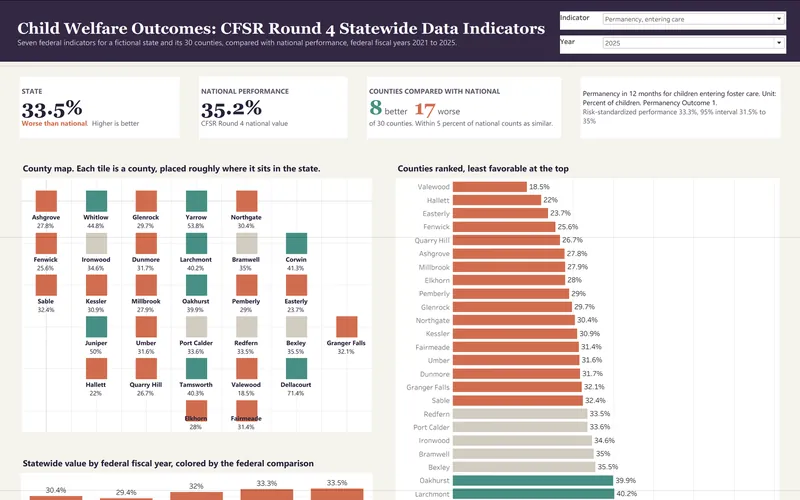
This five-page dashboard tracks the seven federal CFSR Round 4 statewide data indicators for a fictional state with 30 counties over five federal fiscal years. It compares the state with national performance the way the federal data profiles do and shows where counties differ from the state.
Sample data
Nonprofit Finance and Operations
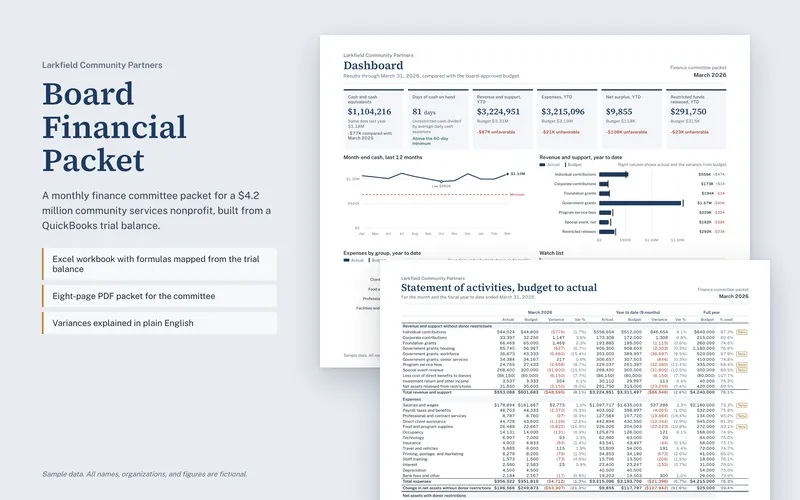
This is a monthly finance committee packet for a fictional $4.2 million community services nonprofit. The Excel workbook builds every report from a QuickBooks trial balance, and the matching eight-page PDF is what the committee reads.
Sample data
Church Operations and Planning Center
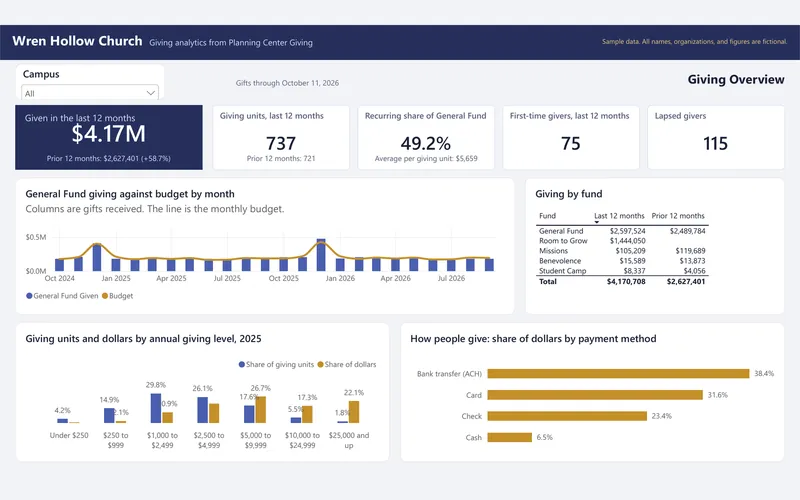
A four-page giving dashboard for a church finance team: giving units, recurring share, first-time and lapsed givers, giving bands, fund mix, monthly giving against budget, and a building campaign tracker. It comes with a Power BI rebuild kit that includes the data tables, a theme file, and every DAX measure.
Sample data