Public Sector and Human Services

SC DSS Accountability Report Measures, FY 2014 to FY 2018

This dashboard and workbook pull every performance measure from five South Carolina Department of Social Services annual accountability reports into one table, link each measure across years, and compare each result with the target printed beside it. Brad prepared four of these reports as the agency's Director of Accountability, Data and Research.

Source: South Carolina Department of Social Services, Annual Accountability Reports to the General Assembly, FY 2014 to FY 2018.

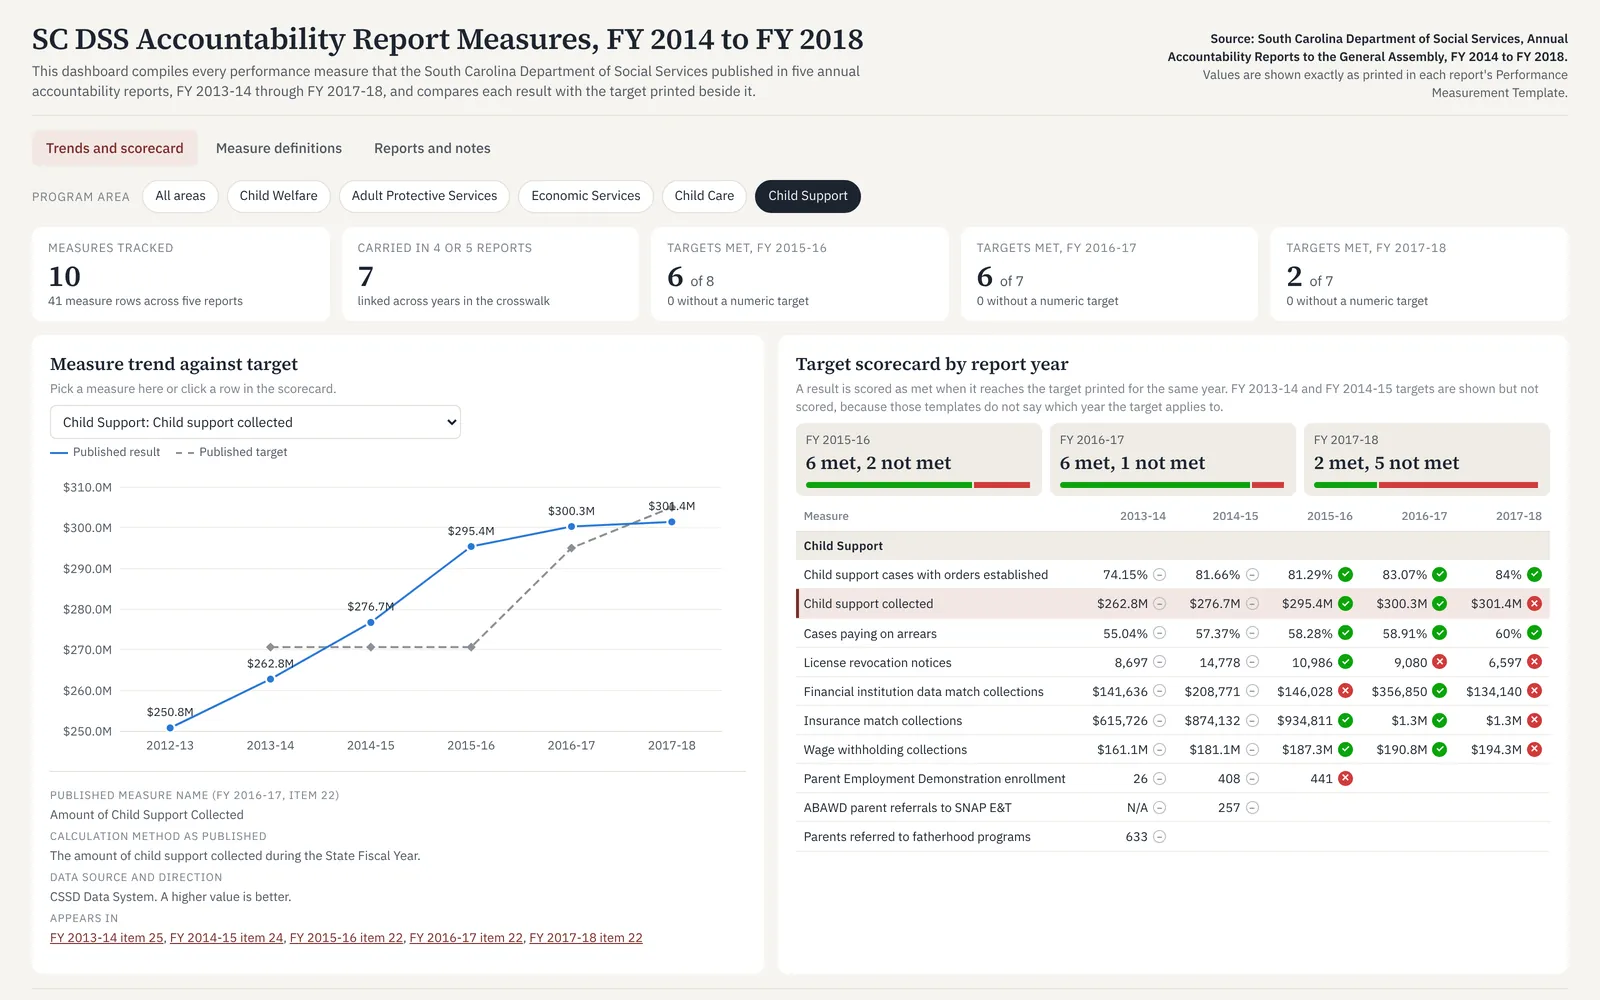
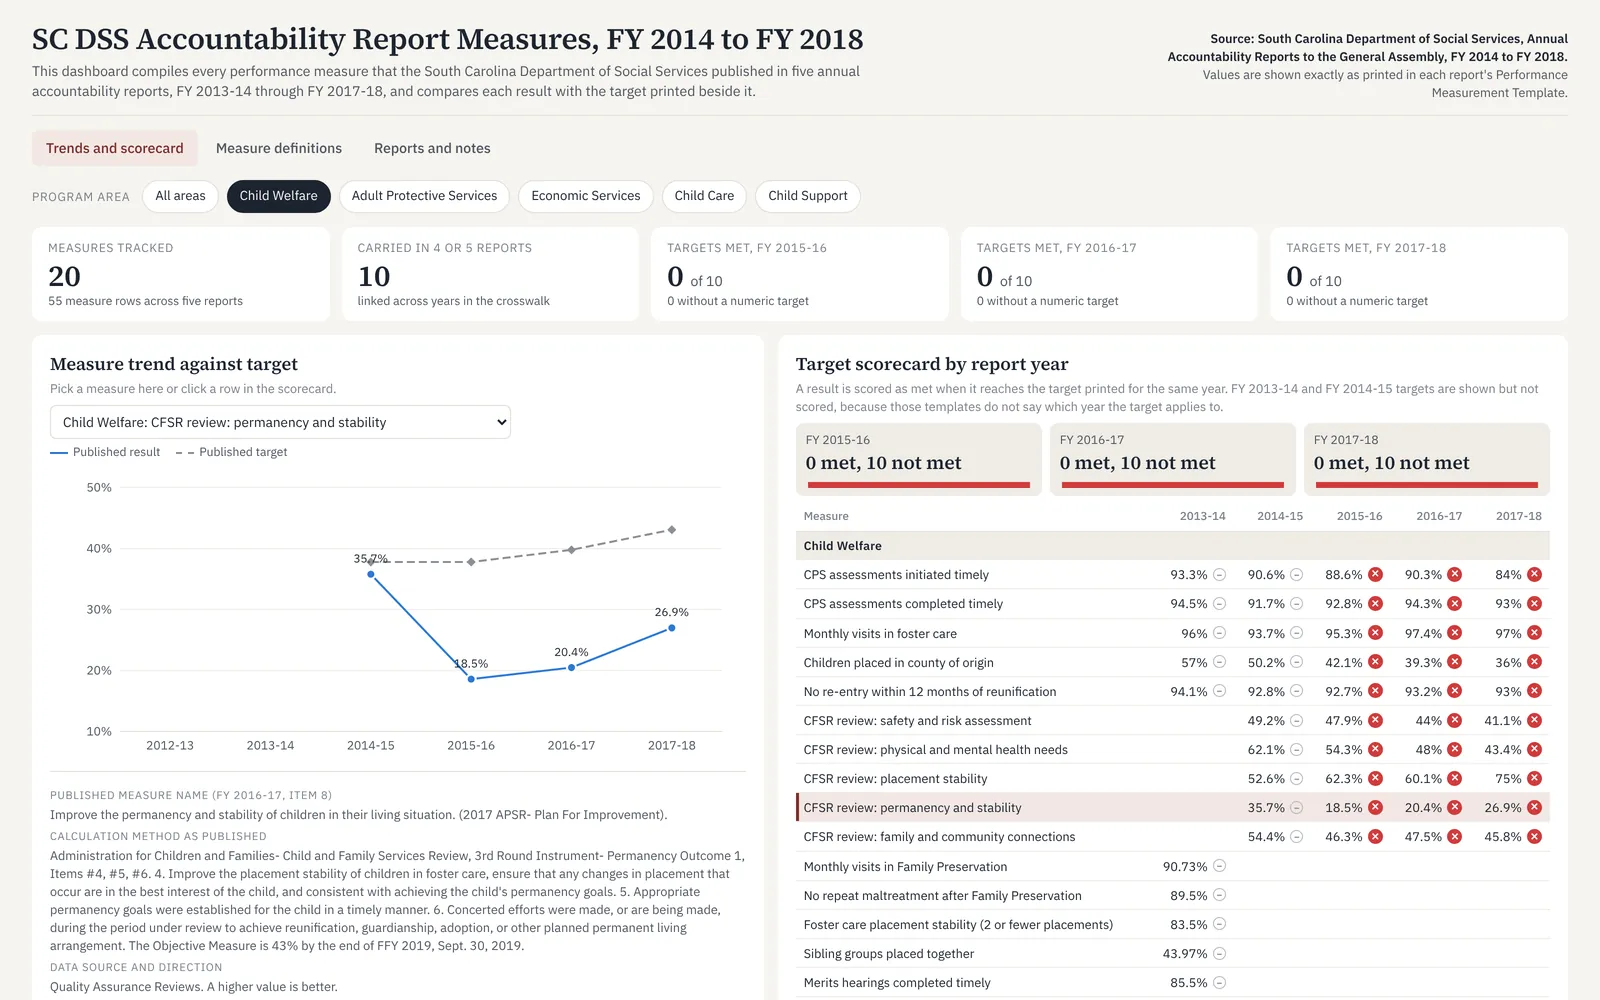
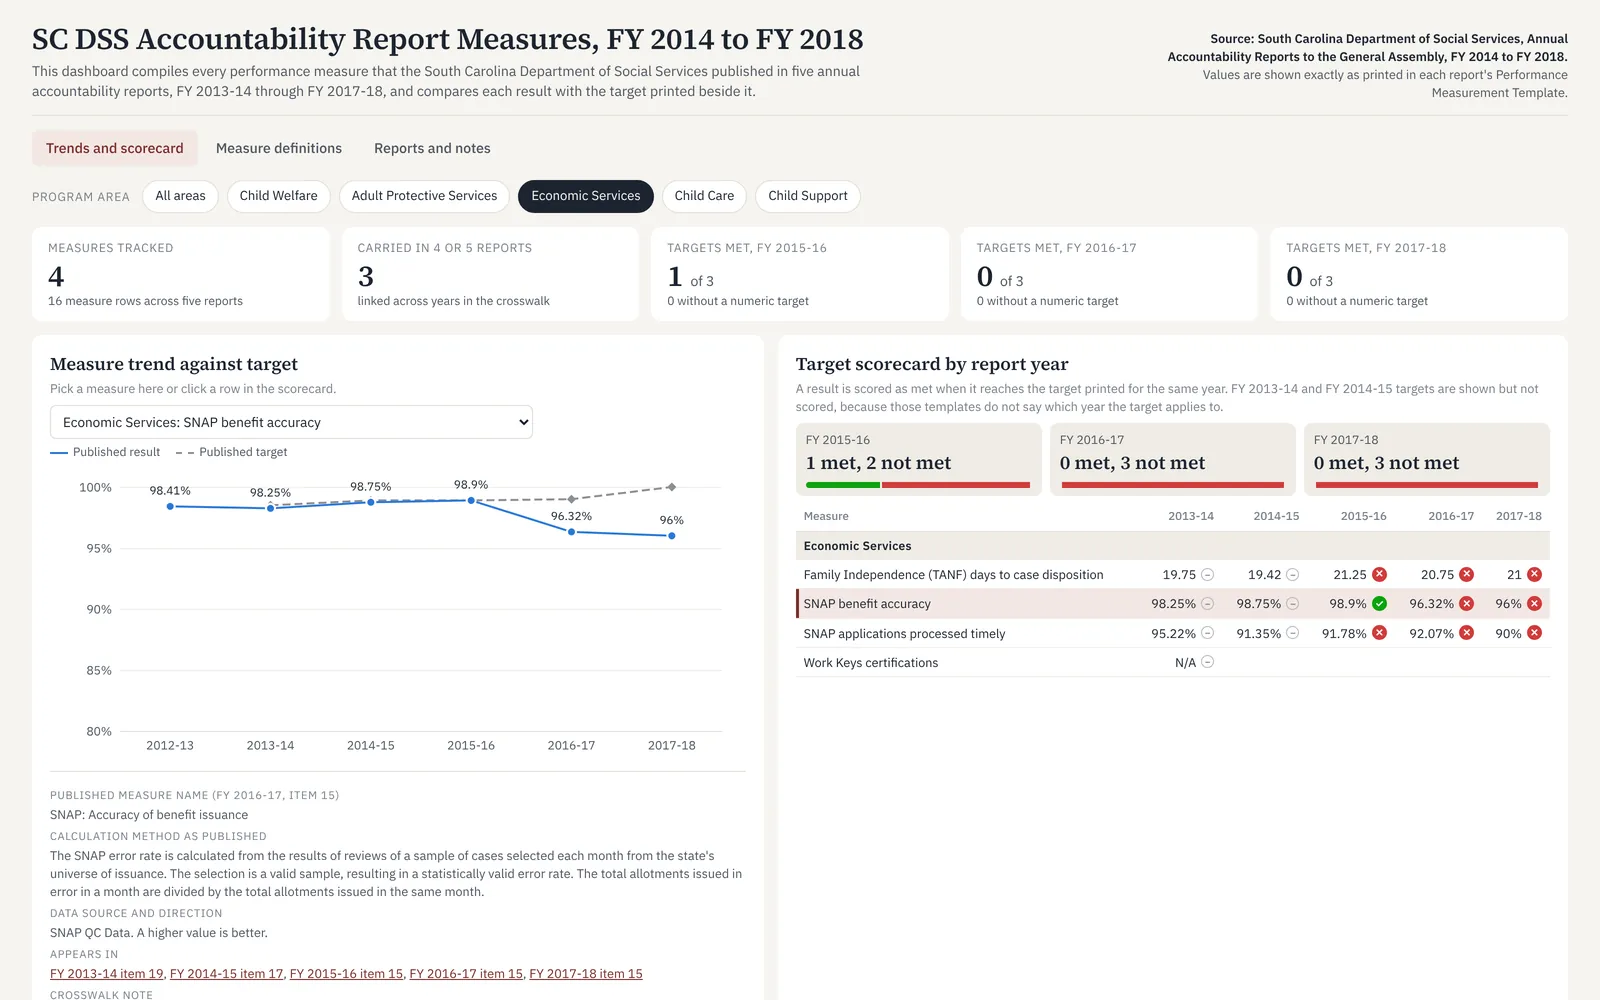
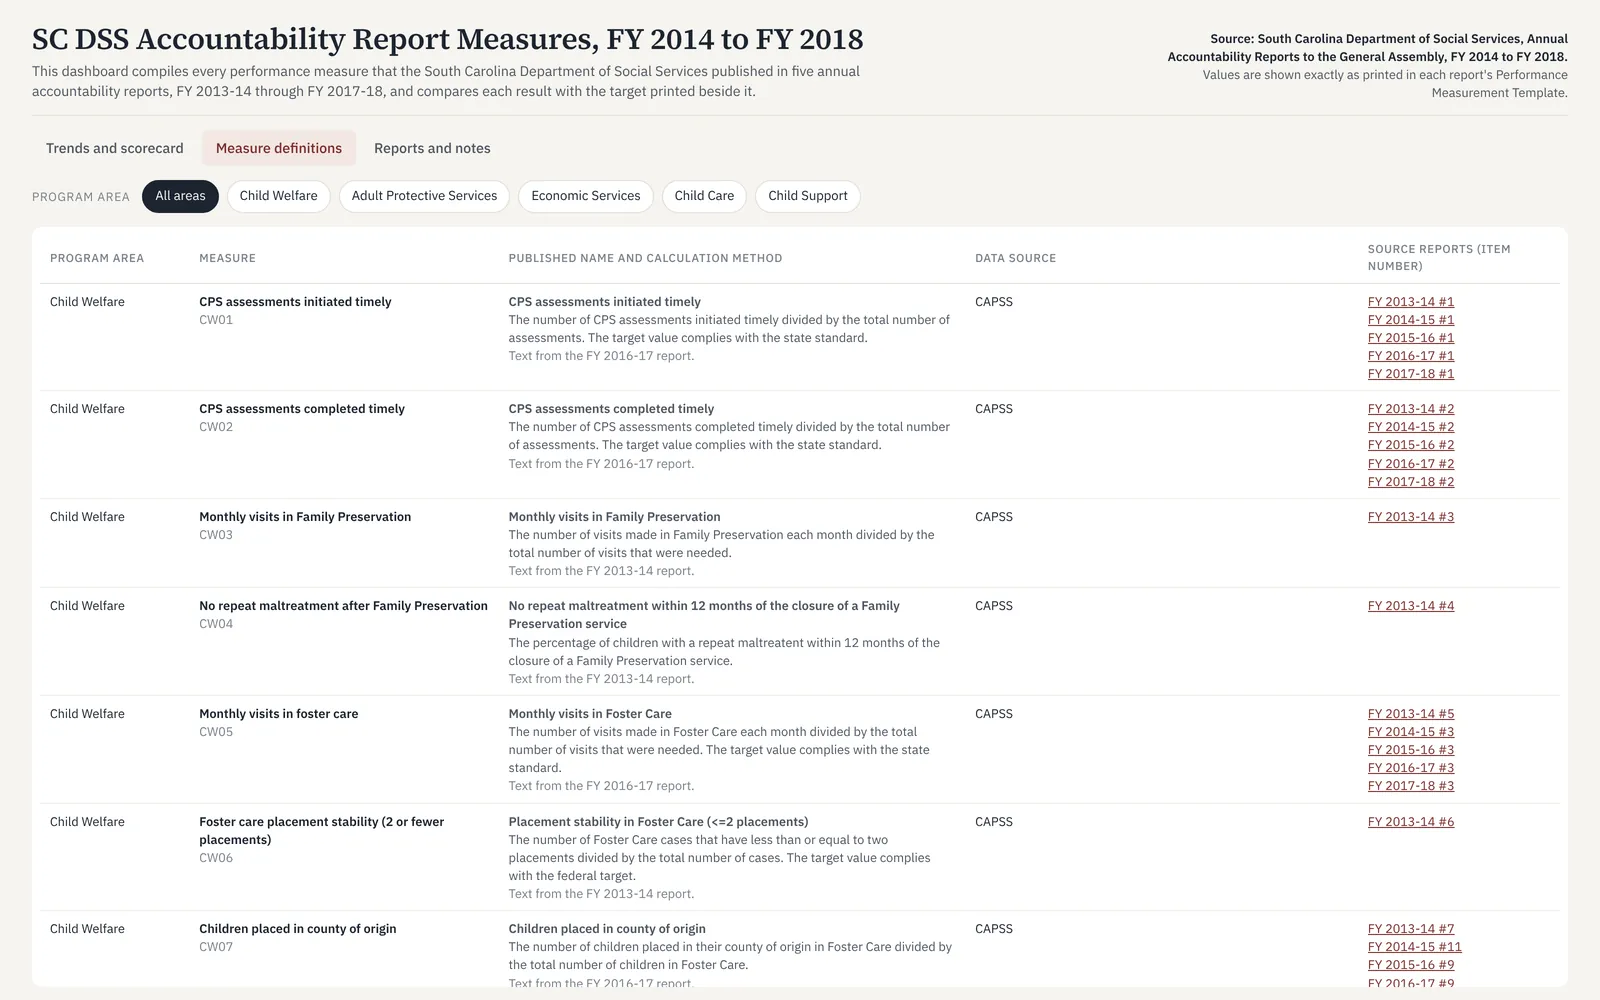
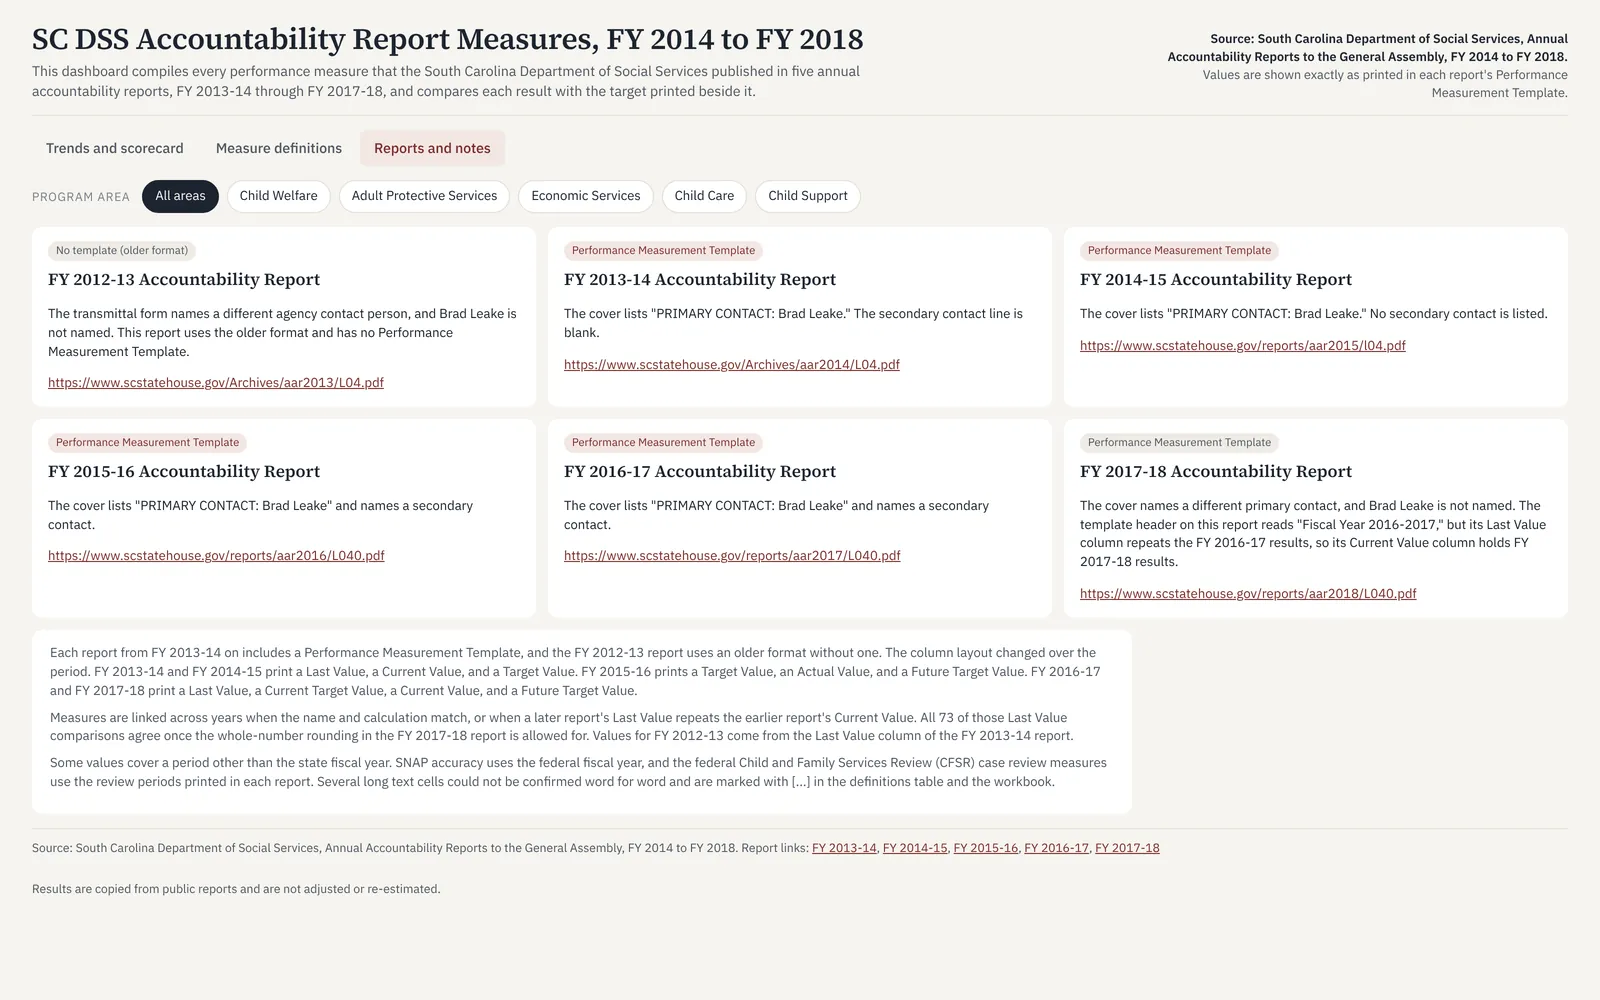
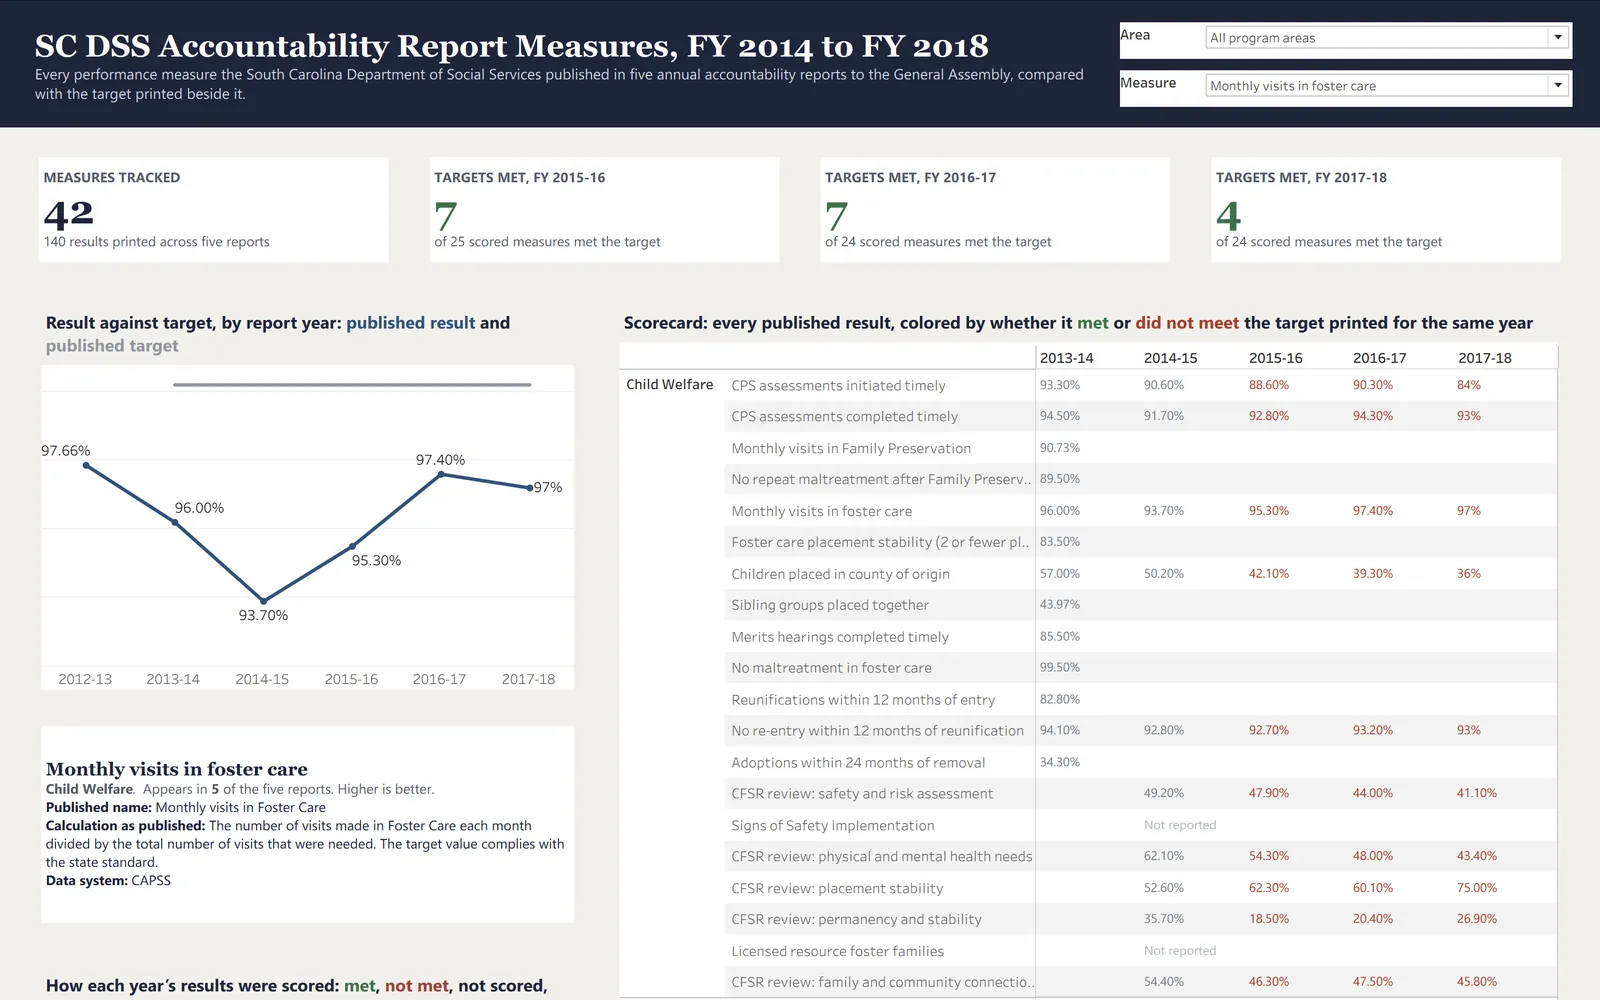
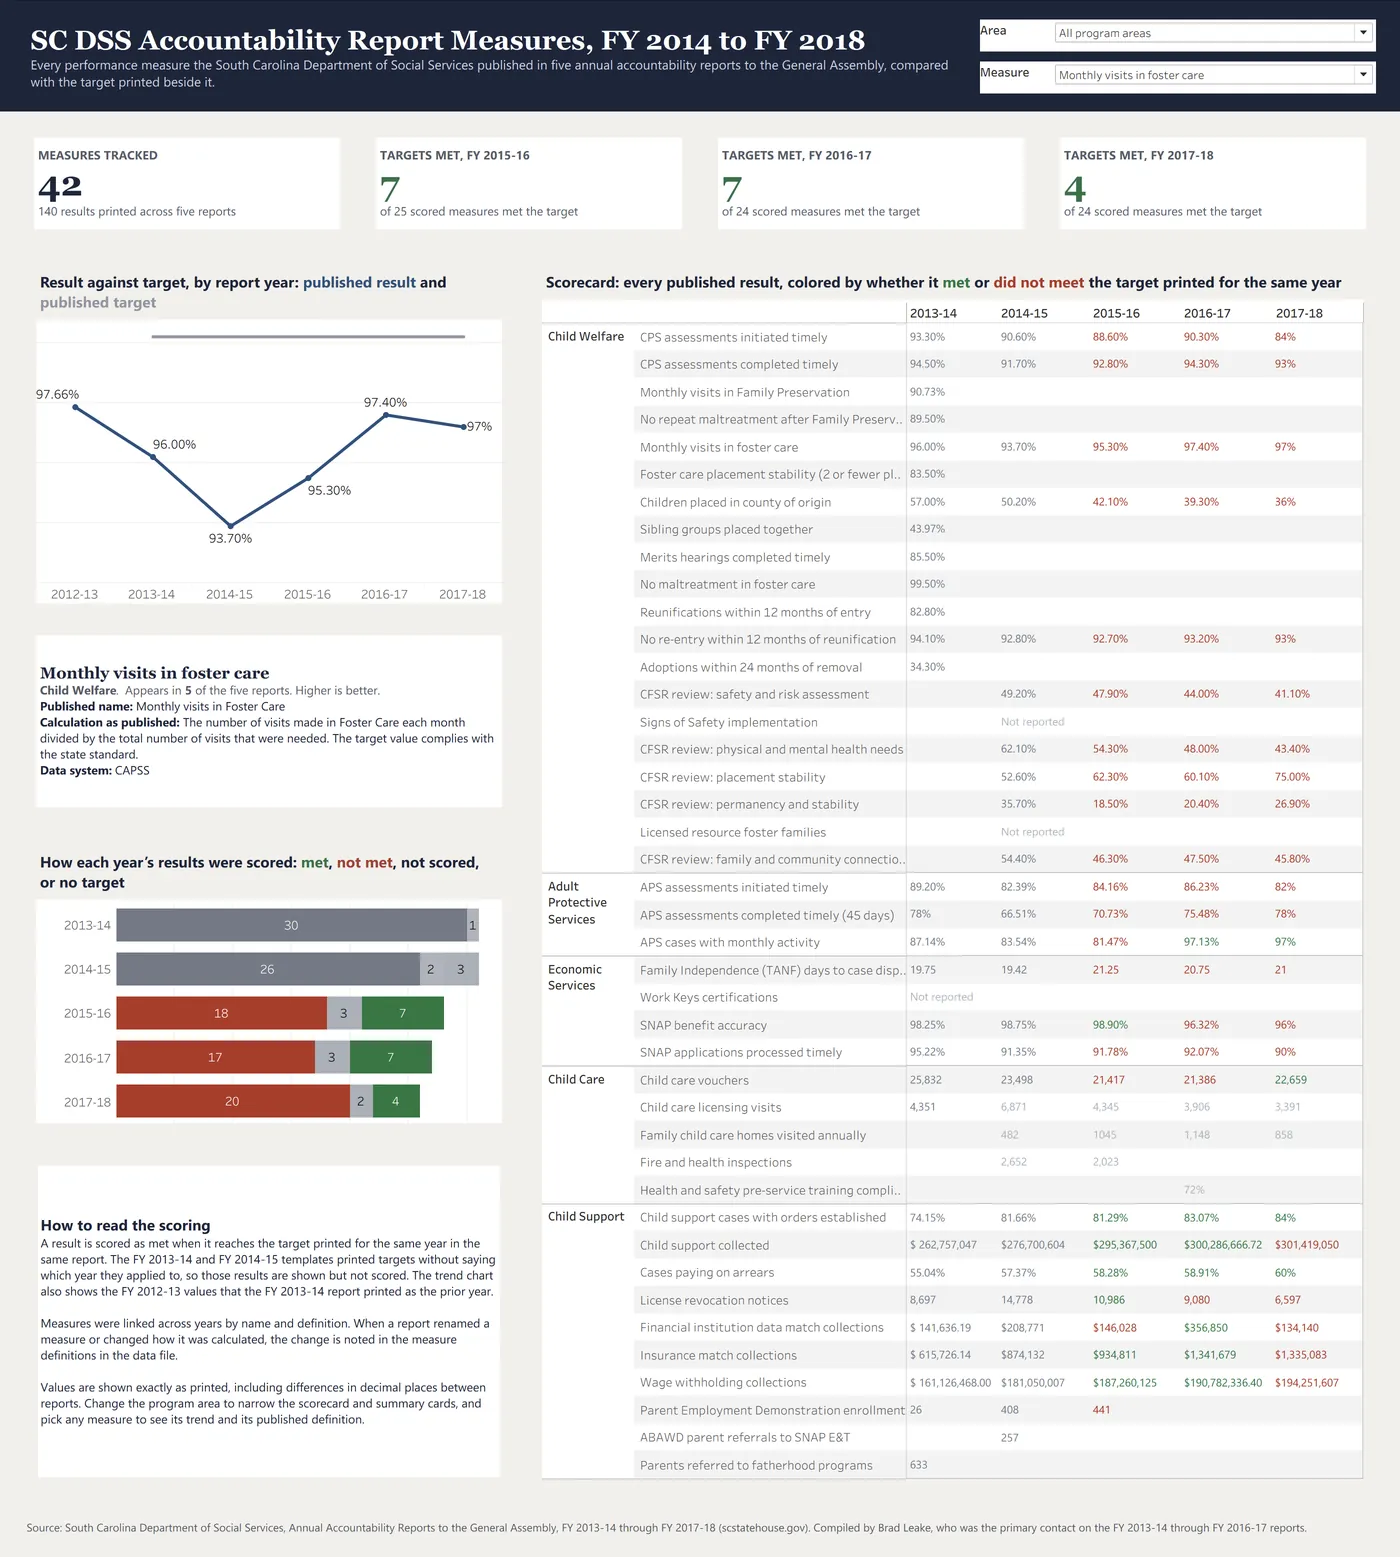
SC DSS Accountability Report Measures, FY 2014 to FY 2018: Tableau dashboardOpen larger image

About this sample

The South Carolina Department of Social Services files an annual accountability report with the Governor and the General Assembly, and each report from FY 2013-14 on includes a Performance Measurement Template covering child welfare, adult protective services, economic services (TANF and SNAP), child care, and child support. This product copies all 145 measure rows from the FY 2013-14 through FY 2017-18 templates exactly as printed, groups them into 42 measure series with a documented crosswalk, and checks each report's Last Value against the prior report's Current Value (all 73 comparisons agree).

The dashboard has a program area filter, a trend chart for any measure against its published targets, a met and not met scorecard for the three years whose templates pair a target with the same year's result, and a table of every measure with its published definition and links to the source reports. The package also includes an Excel workbook with formulas and conditional formatting, Tableau-ready data with a rebuild guide, and a two-page summary of what the measures show. The Tableau workbook is included as a packaged file that opens in Tableau Public or Tableau Desktop.
What it includes

  • Tableau workbook with program area and measure selectors, summary cards, a result-against-target trend, a scoring mix by year, and a full scorecard of every published result
  • All 145 measure rows from five public accountability reports, copied as printed with links to each report
  • Crosswalk linking 42 measure series across years, with notes where names or calculations changed
  • Trend chart for any measure against its published targets, FY 2012-13 to FY 2017-18
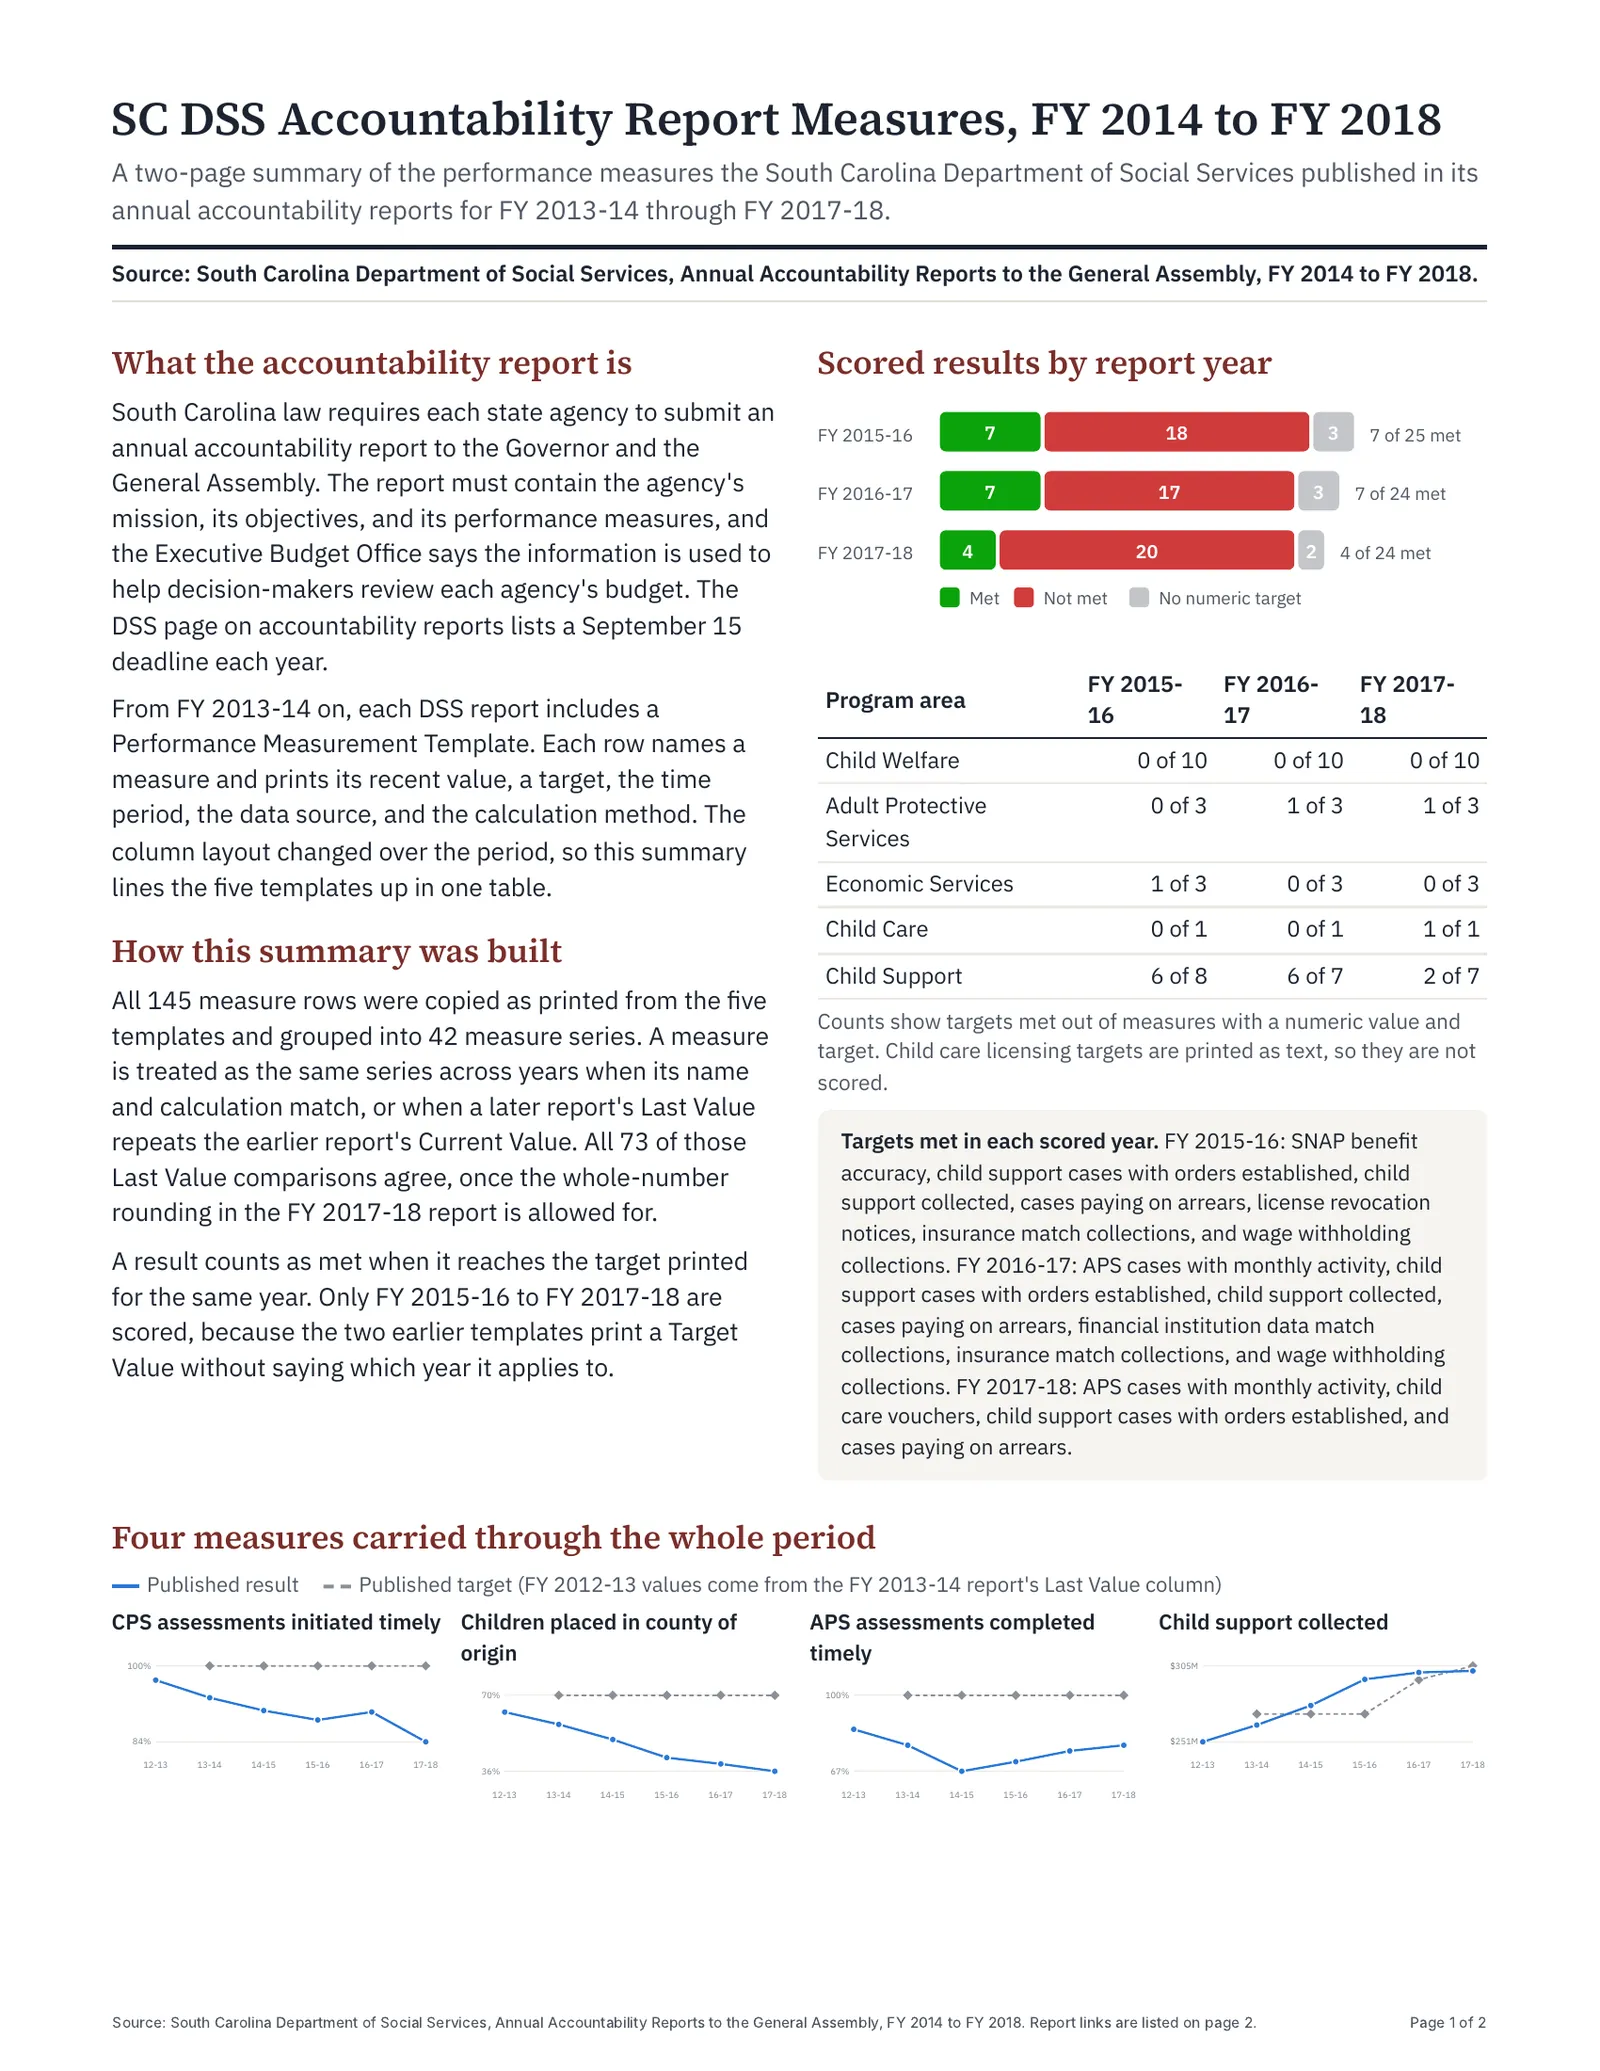
  • Met and not met scorecard by program area for FY 2015-16 to FY 2017-18
  • Excel workbook with a long table, a year-by-measure view with formulas and conditional formatting, a scorecard, consistency checks, and sources
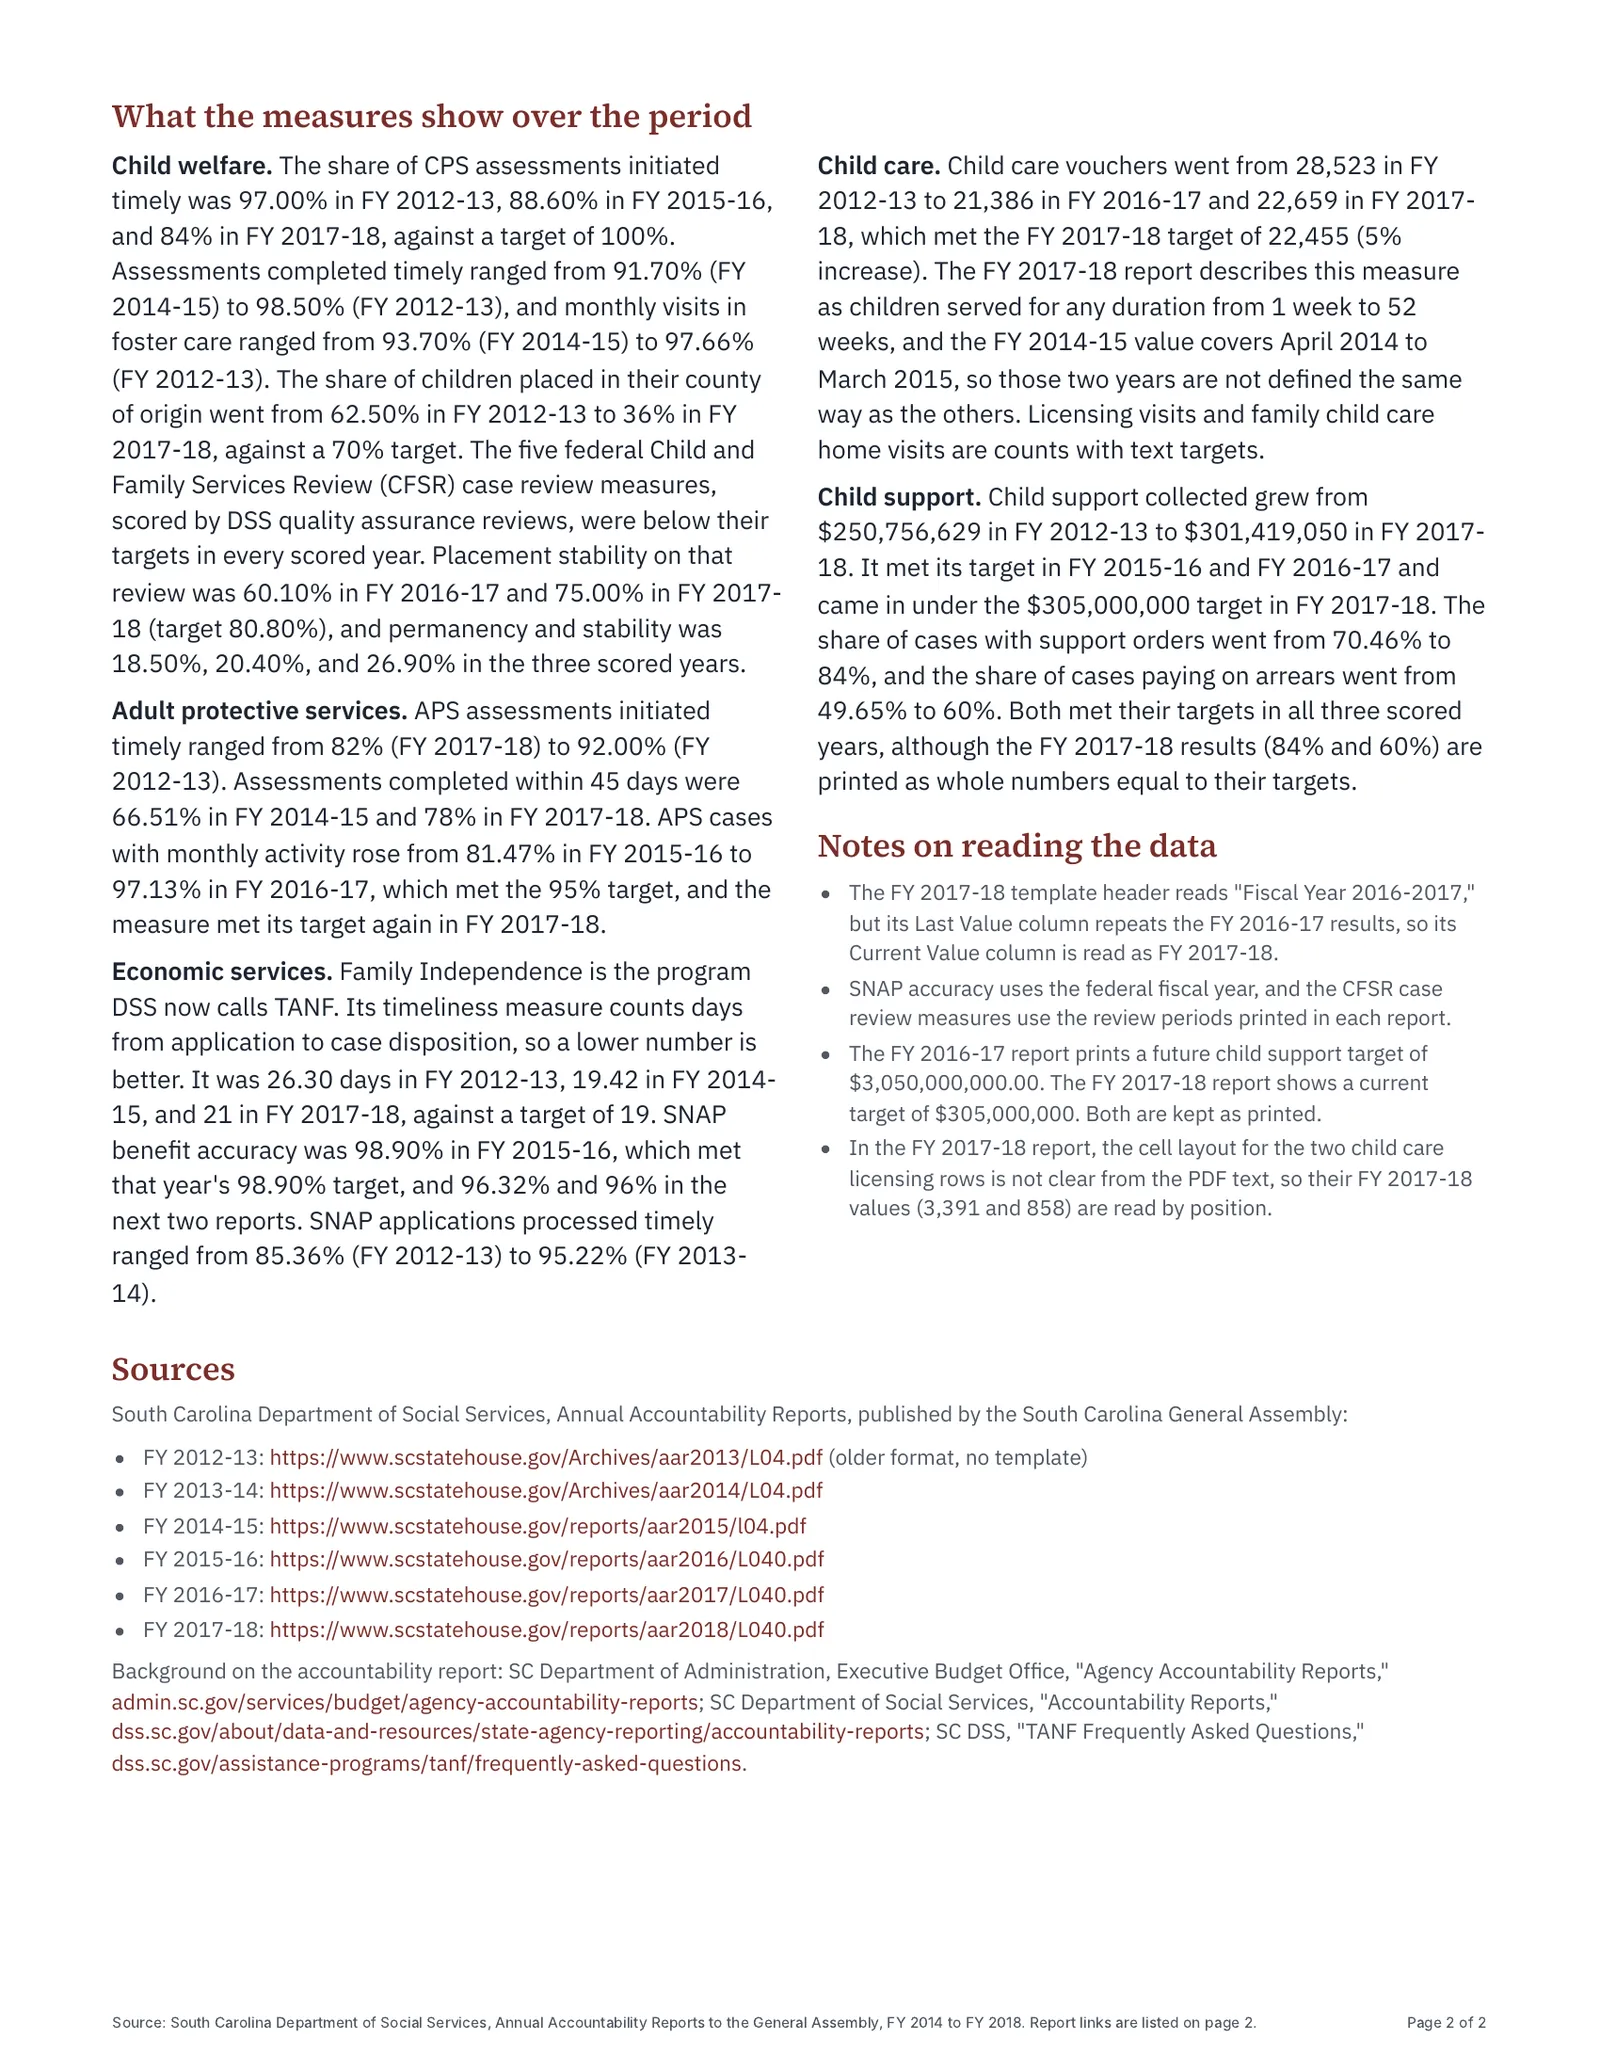
  • Two-page summary explaining the accountability report and what the measures show

Screenshots

Select an image to see it larger.

More in Public Sector and Human Services

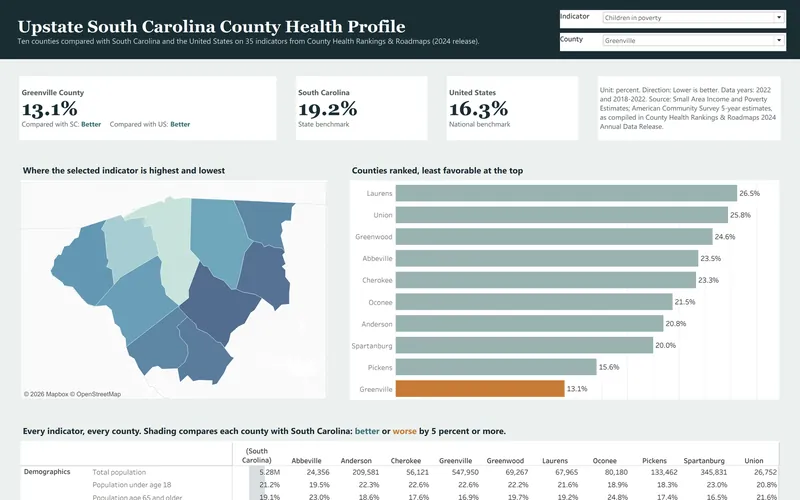
County Health Profile: Upstate South Carolina

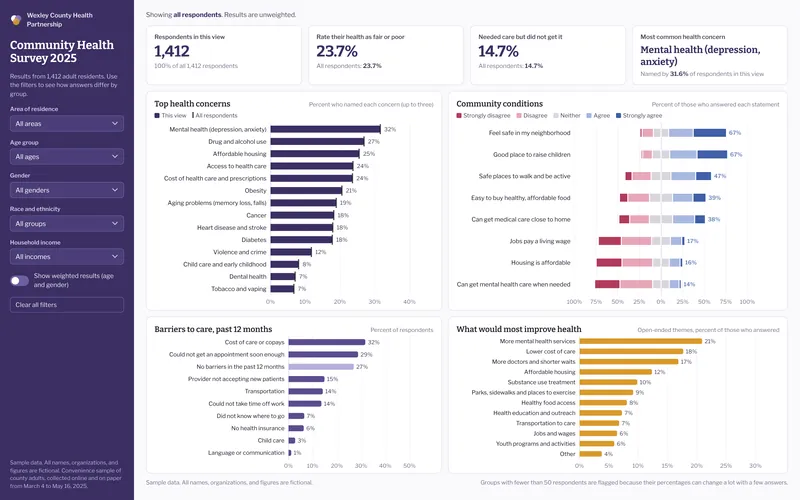
This is the secondary data profile from a community health needs assessment for ten Upstate South Carolina counties, and it is built from the 2024 County Health Rankings release. It compares 35 county indicators with state and national values and turns them into a dashboard, a 14-page report and an Excel workbook.

  • Excel
  • Tableau
  • PDF report

Public data

Community Health Survey Results

This sample analyzes a fictional county community health survey with 1,412 respondents, which is the kind of survey hospitals run as part of a community health needs assessment. It includes a filterable dashboard, an 8-page results brief and an Excel workbook with crosstabs, a codebook and weighting.

  • Excel
  • Power BI
  • PDF report

Sample data