Nonprofit Finance and Operations

Grant Review Operations Tracker

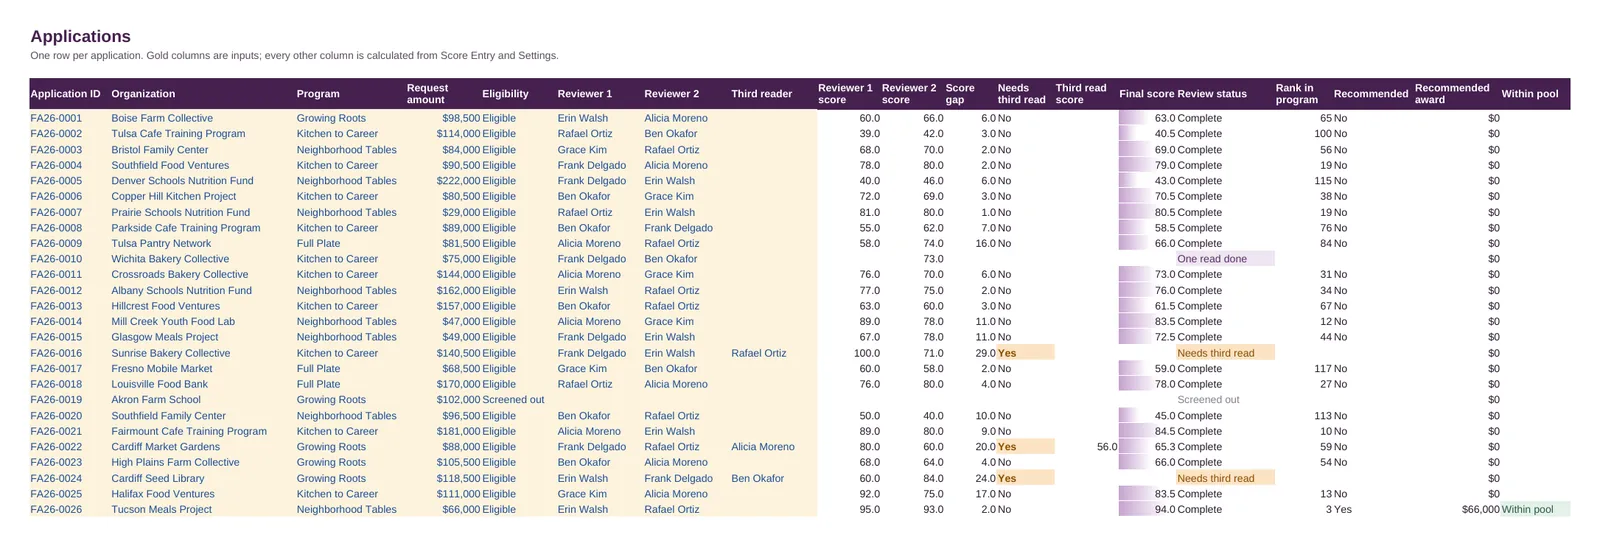
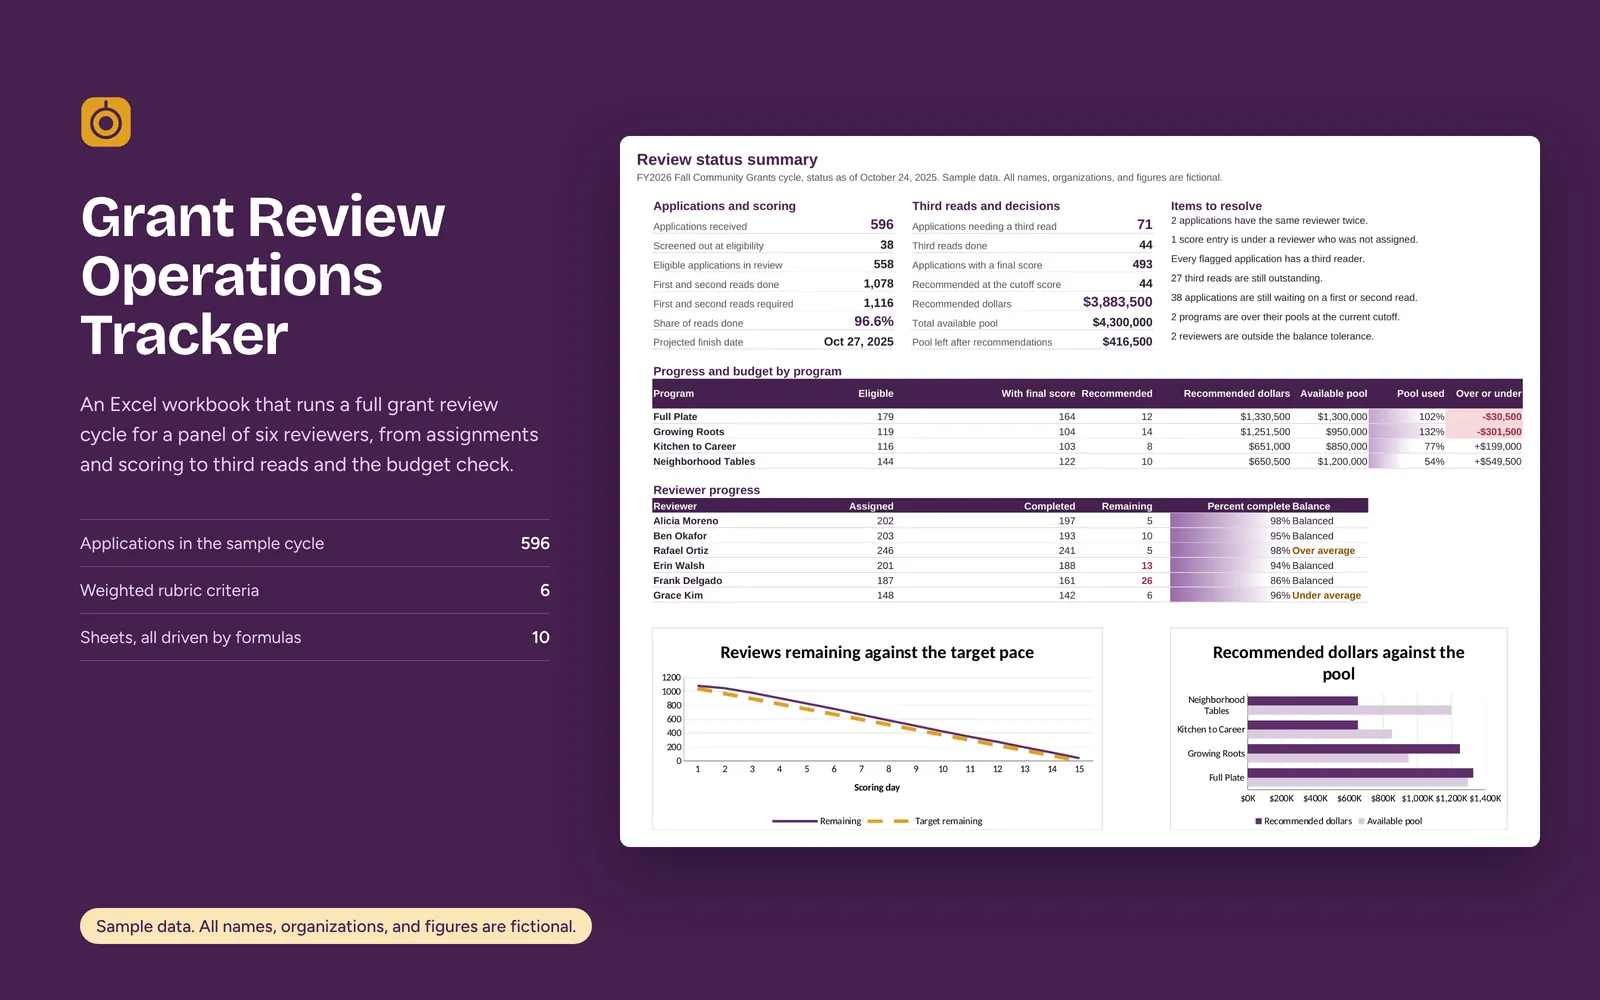
This is an Excel workbook for running a grant review cycle with a panel of six to eight reviewers. It tracks assignments, scores, daily pace, third reads, and whether recommended awards fit each program's budget.

Sample data. All names, organizations, and figures are fictional.

Grant Review Operations Tracker: Review trackerOpen larger image

About this sample

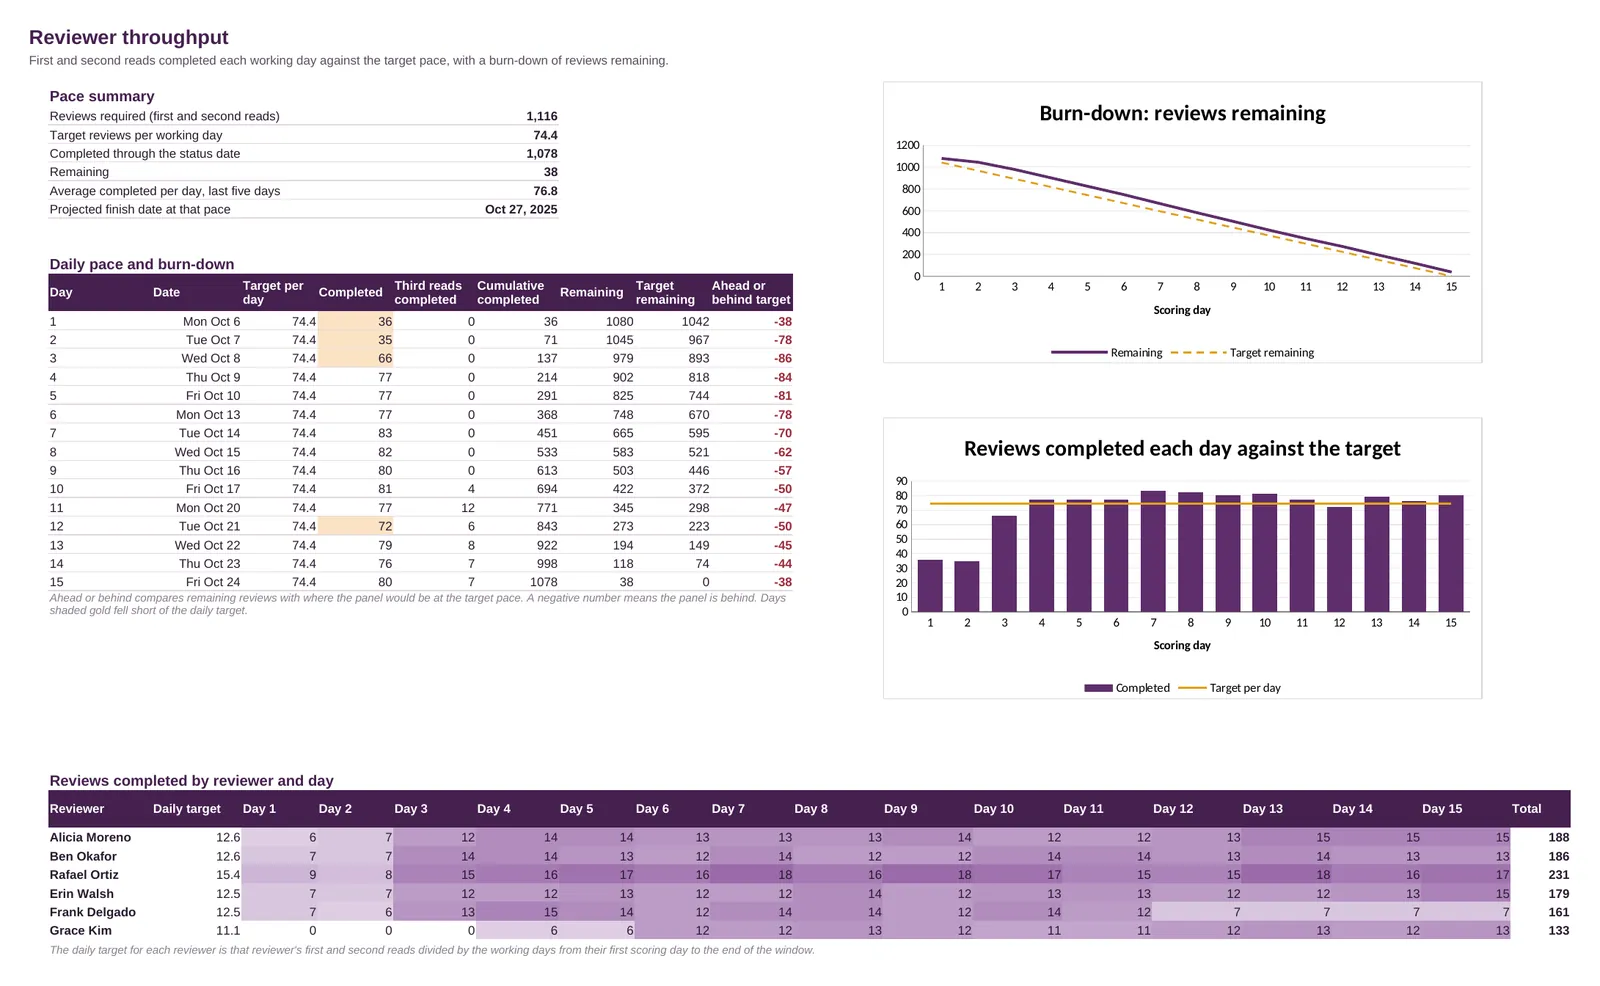
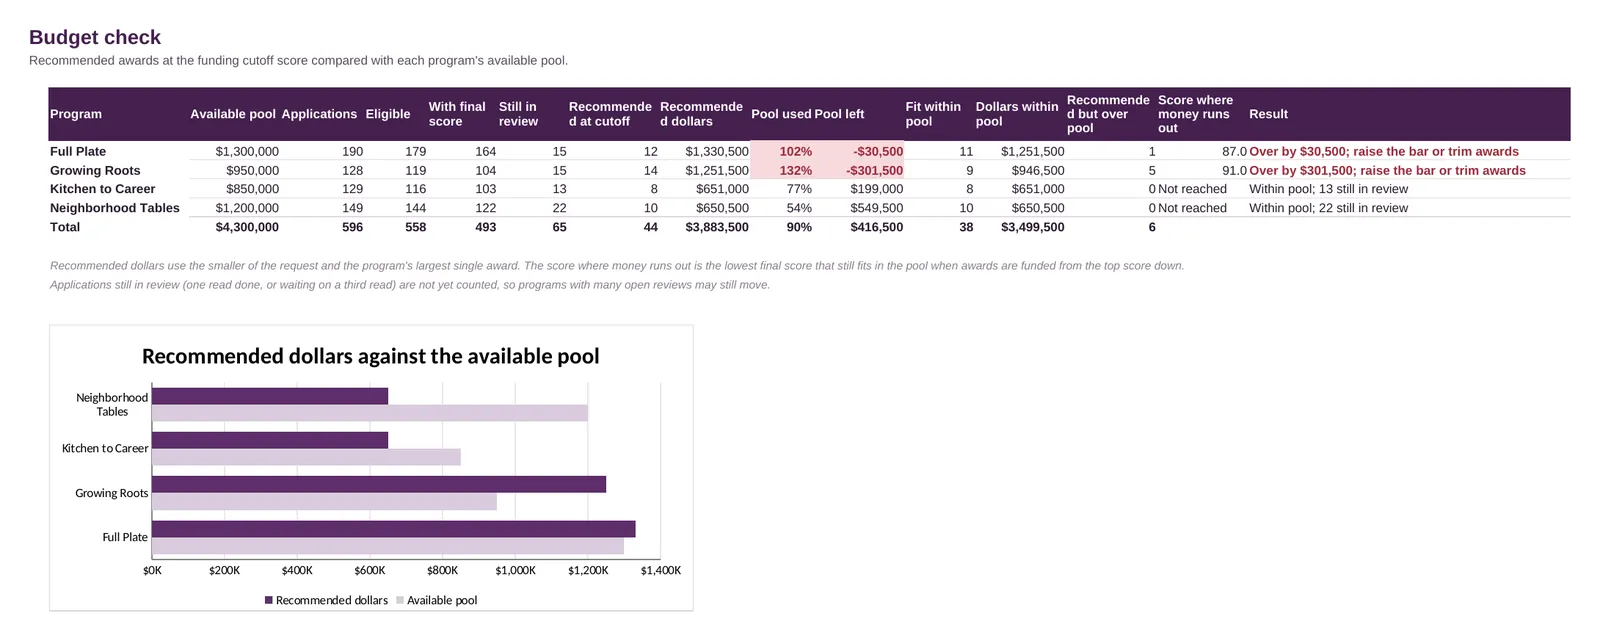
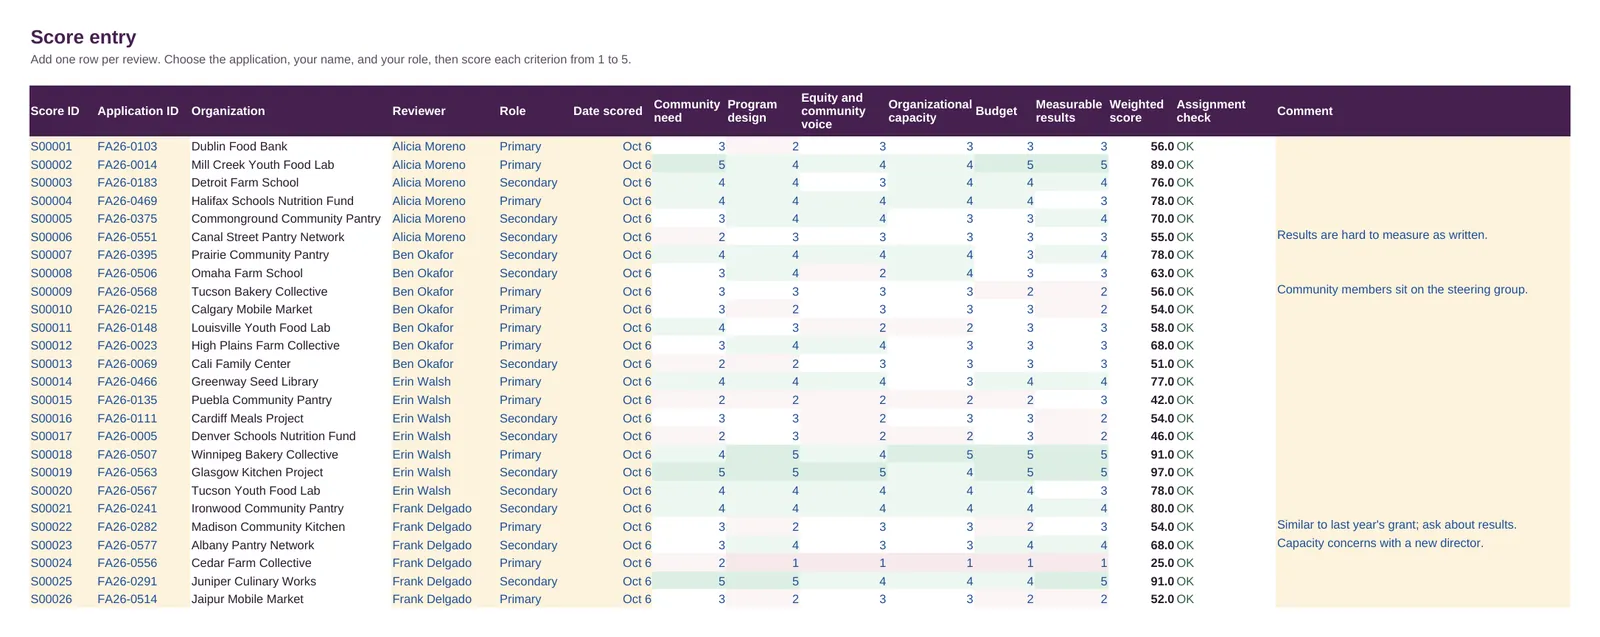
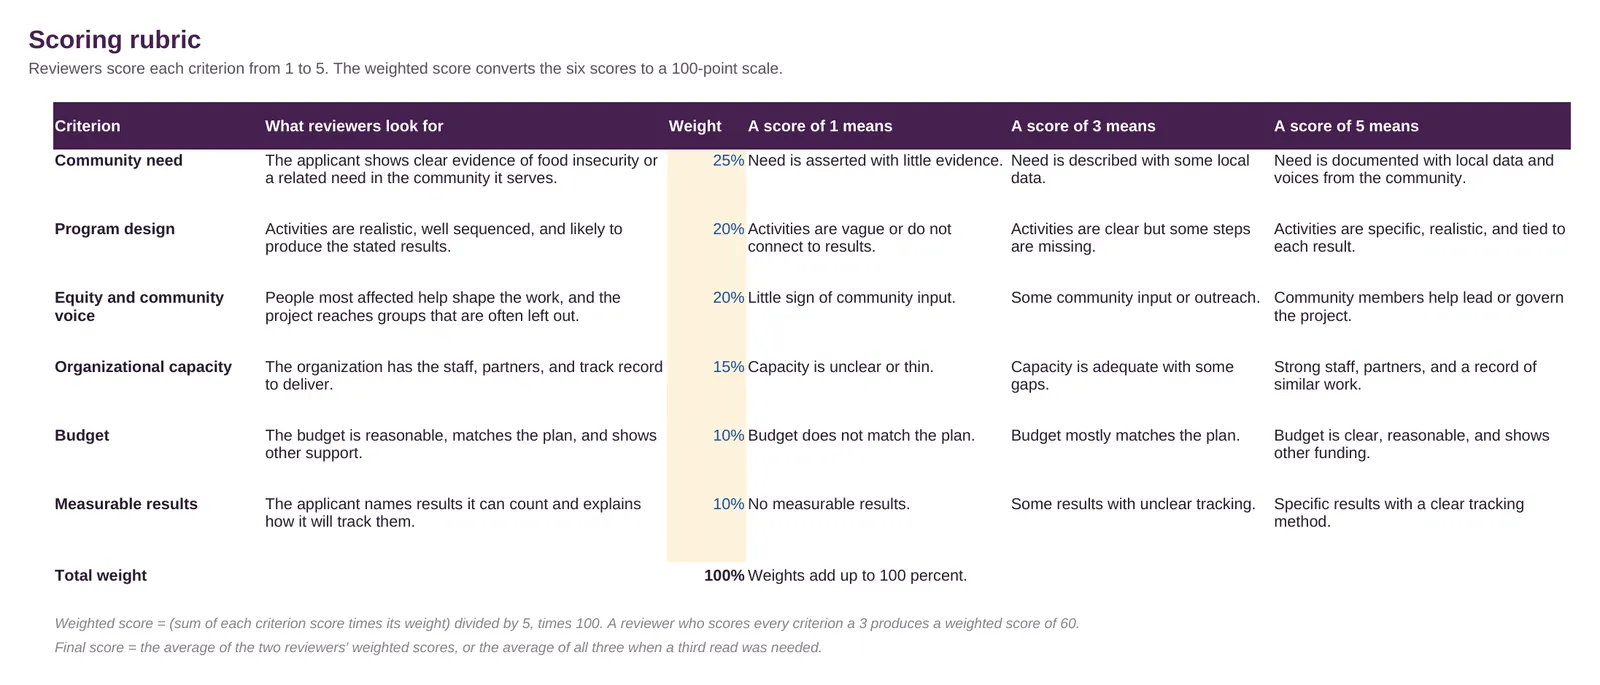
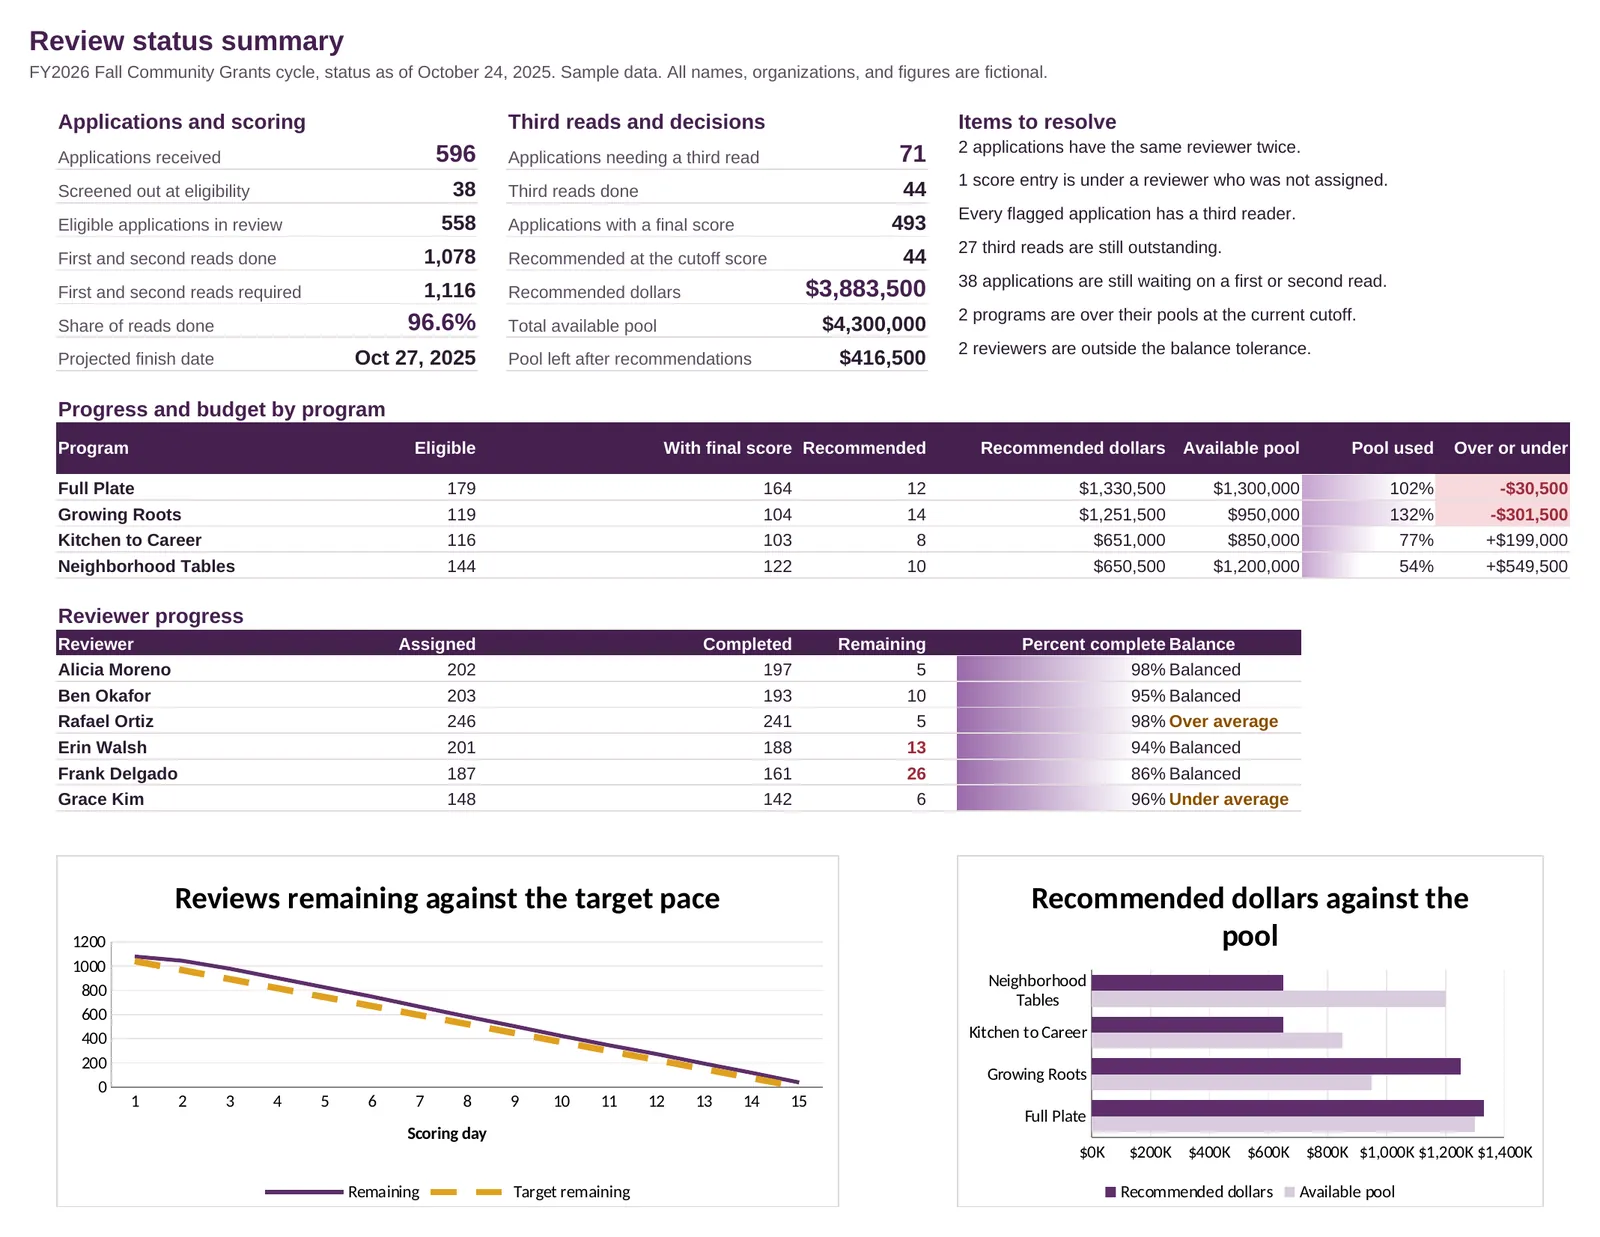
The sample cycle has 596 fictional applications across four programs and a panel of six reviewers. The coordinator assigns two reviewers to each application, reviewers enter scores against a weighted six-criterion rubric, and the workbook flags any application whose two scores differ by 18 points or more for a third read. A throughput sheet compares reviews completed each day with the target pace and shows a burn-down and projected finish date, while a budget check compares recommended awards at the cutoff score with each program's pool and shows the score where each program's money runs out.

Everything is built with Excel tables, formulas, data validation, conditional formatting, and native charts, so changing the cutoff score or the disagreement threshold updates every sheet. A one-page status summary shows leadership the counts, the budget picture, and a list of items the coordinator still needs to resolve.
What it includes

  • The applications table tracks eligibility, two reviewers, and a third reader when one is needed.
  • The weighted scoring rubric checks that its weights add up to 100 percent.
  • Score entry uses dropdown lists and 1 to 5 validation on every criterion.
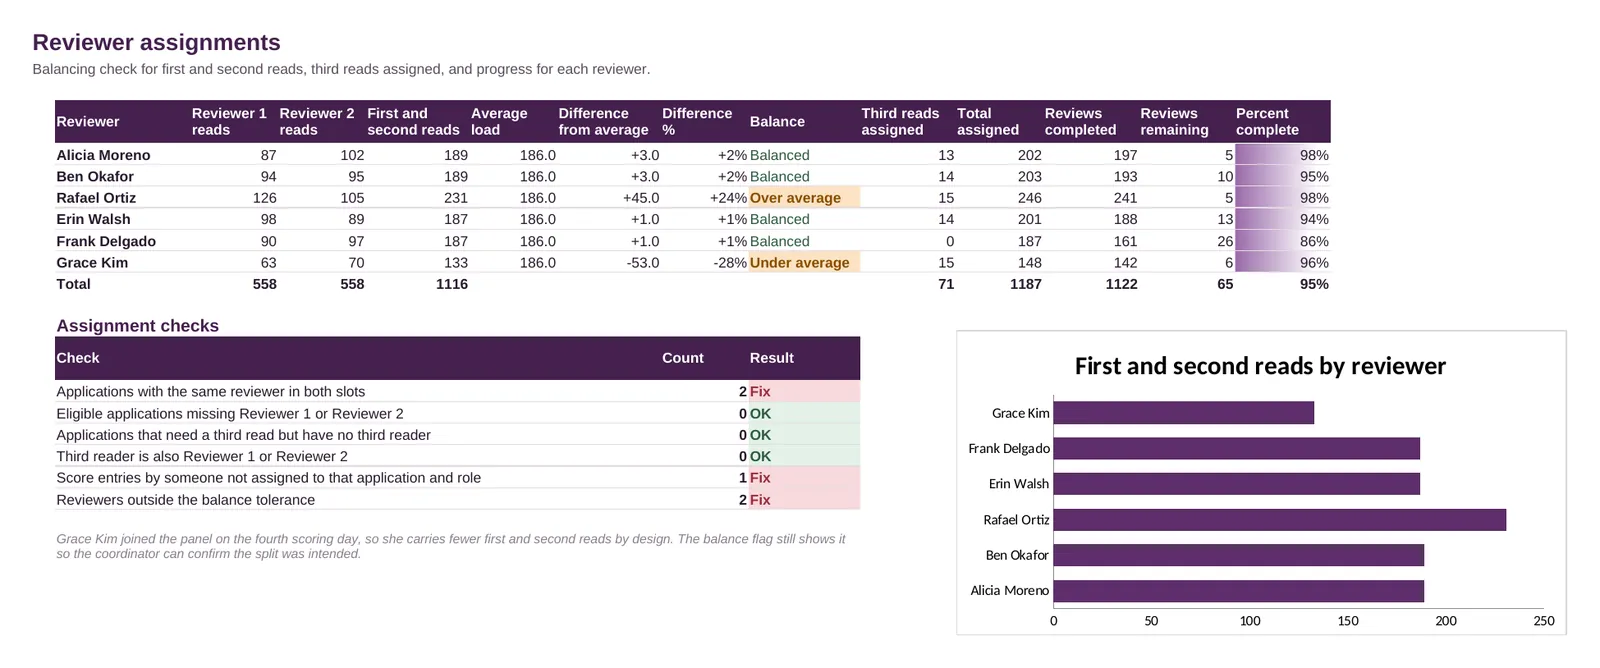
  • An assignment balancing check flags reviewers above or below the average load.
  • Built-in checks catch duplicate reviewers and scores entered under the wrong name.
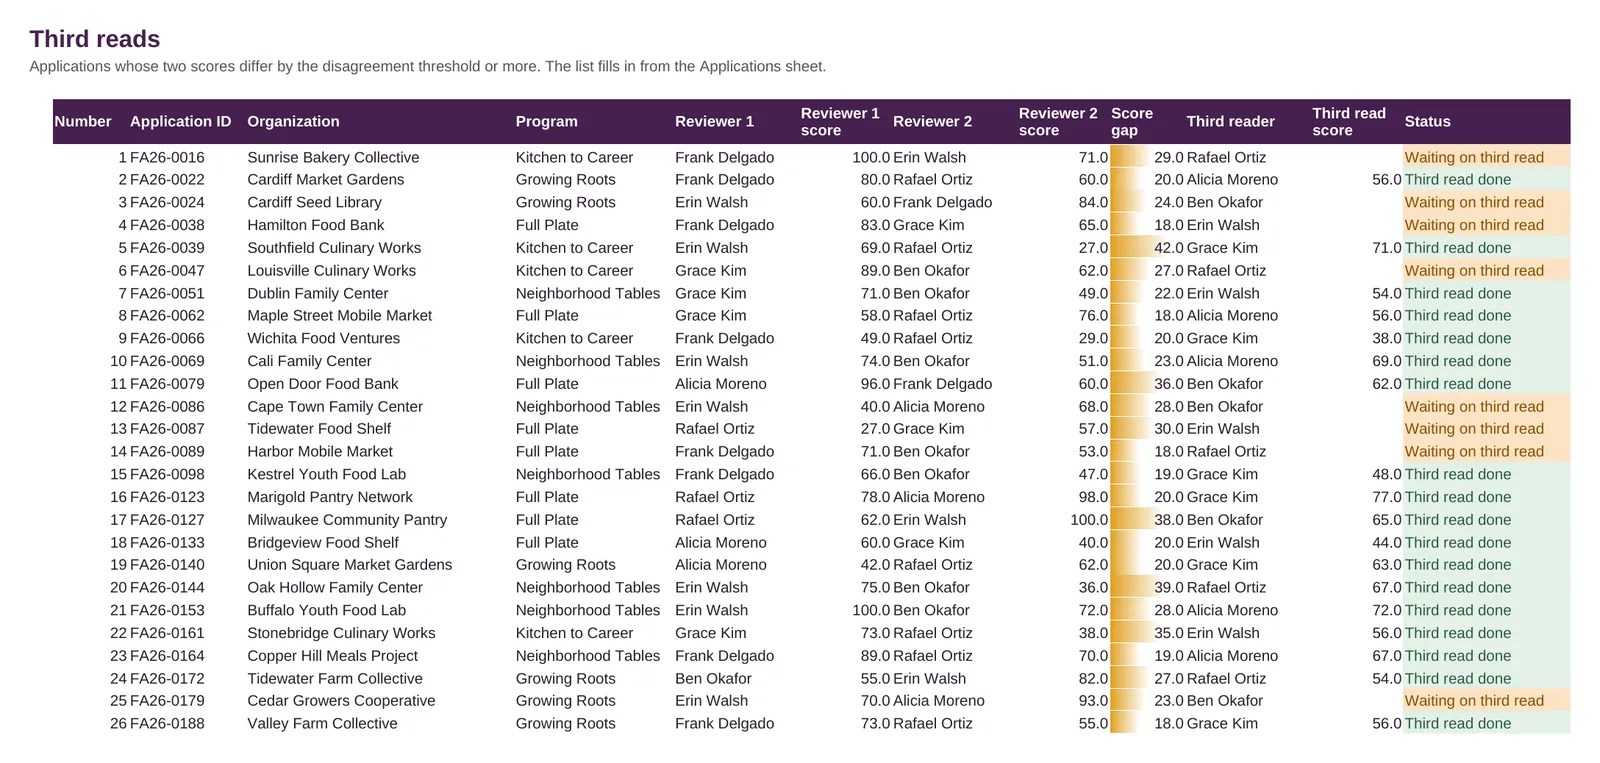
  • Applications are flagged for a third read when two scores disagree by the threshold.
  • A throughput sheet tracks daily progress against a target pace with a burn-down chart.
  • A budget check compares recommended awards with each program's pool.

Screenshots

Select an image to see it larger.

More in Nonprofit Finance and Operations

Community Benefit Reporting Workbook

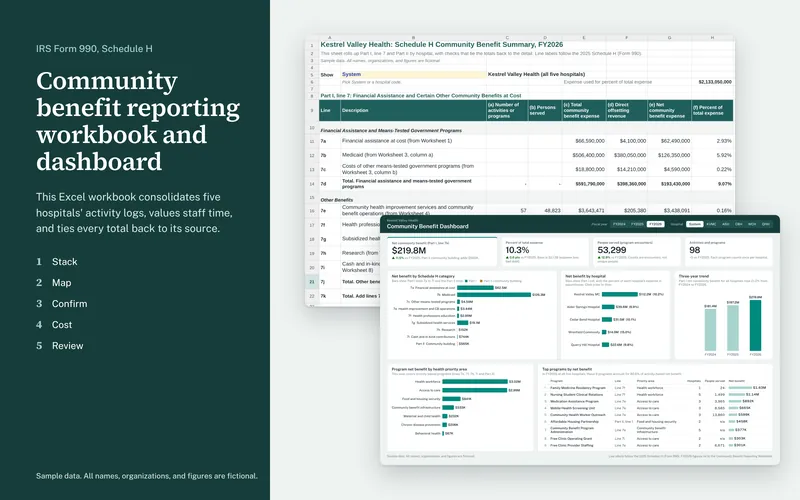
This Excel workbook consolidates five hospitals' community benefit activity logs into one dataset and rolls it up to the lines of IRS Form 990, Schedule H. Every total on the summary ties back through formulas to the row a hospital reported.

  • Excel
  • PDF report

Sample data

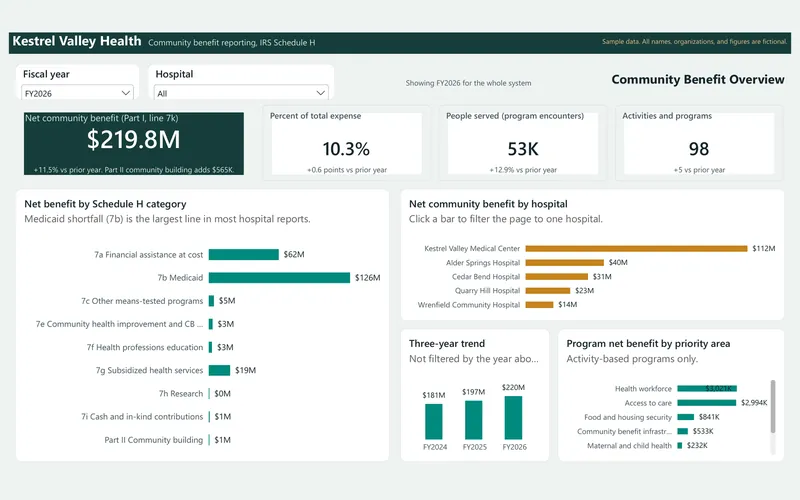
Community Benefit Dashboard

This interactive dashboard shows a hospital system's community benefit across three fiscal years, built from the same sample data as the reporting workbook. It comes with star-schema data files, a Power BI theme, and a rebuild guide with every DAX measure.

  • Power BI
  • Excel
  • PDF report

Sample data