Nonprofit Finance and Operations

Budget and Forecast Model

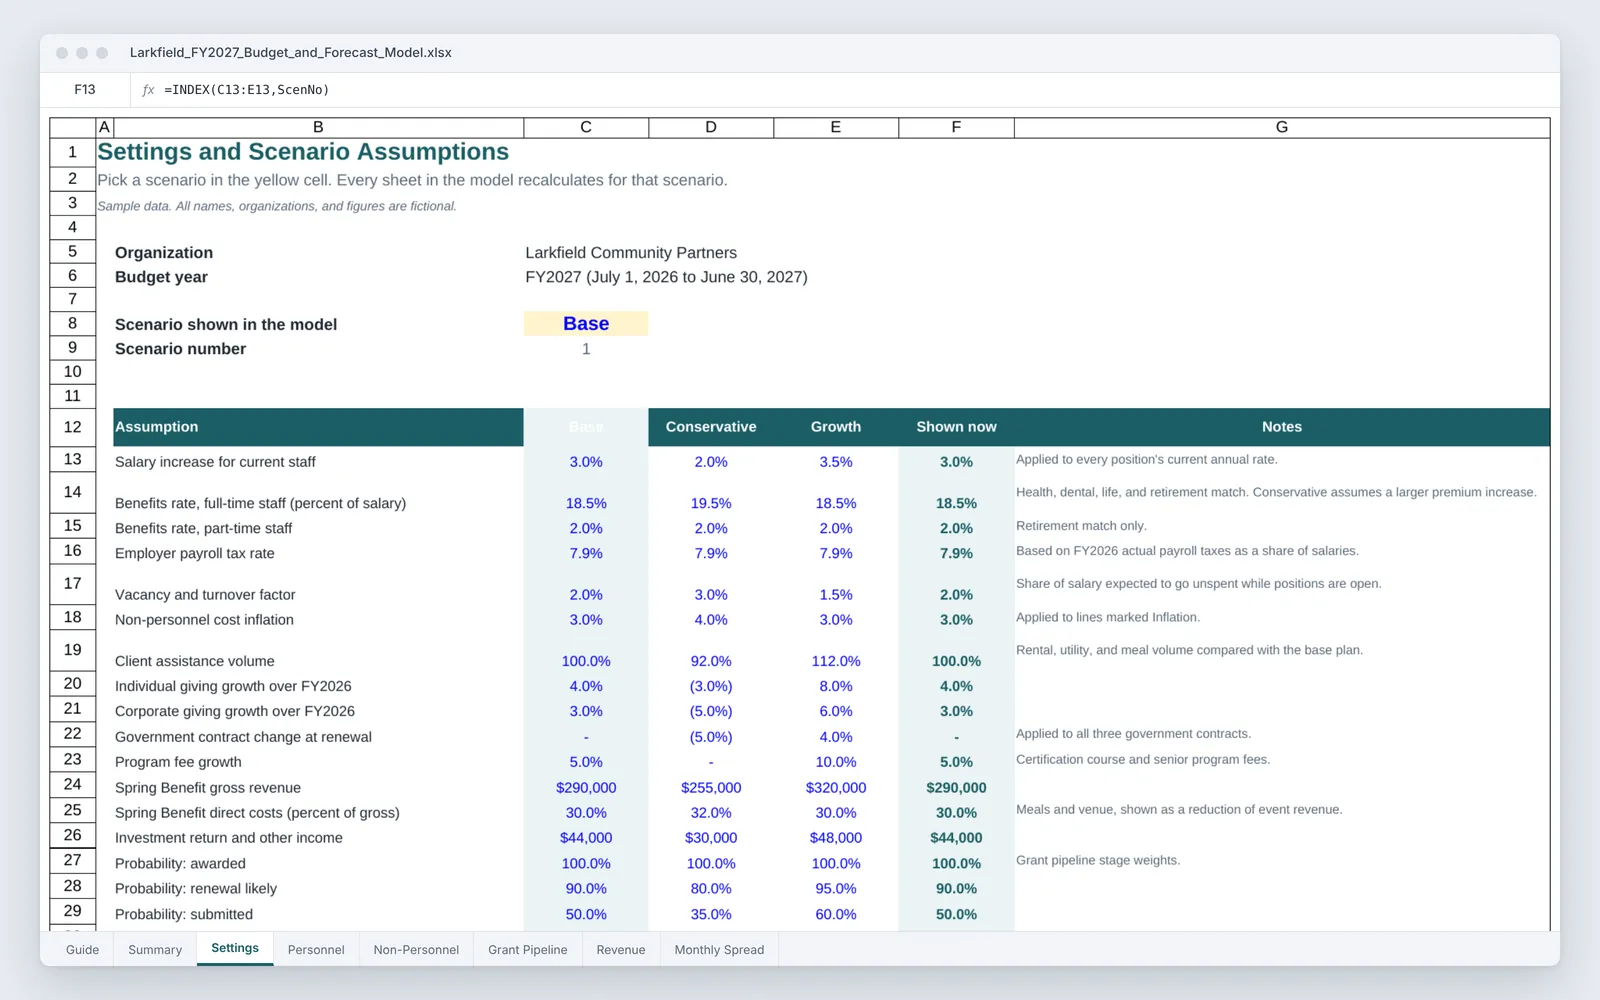
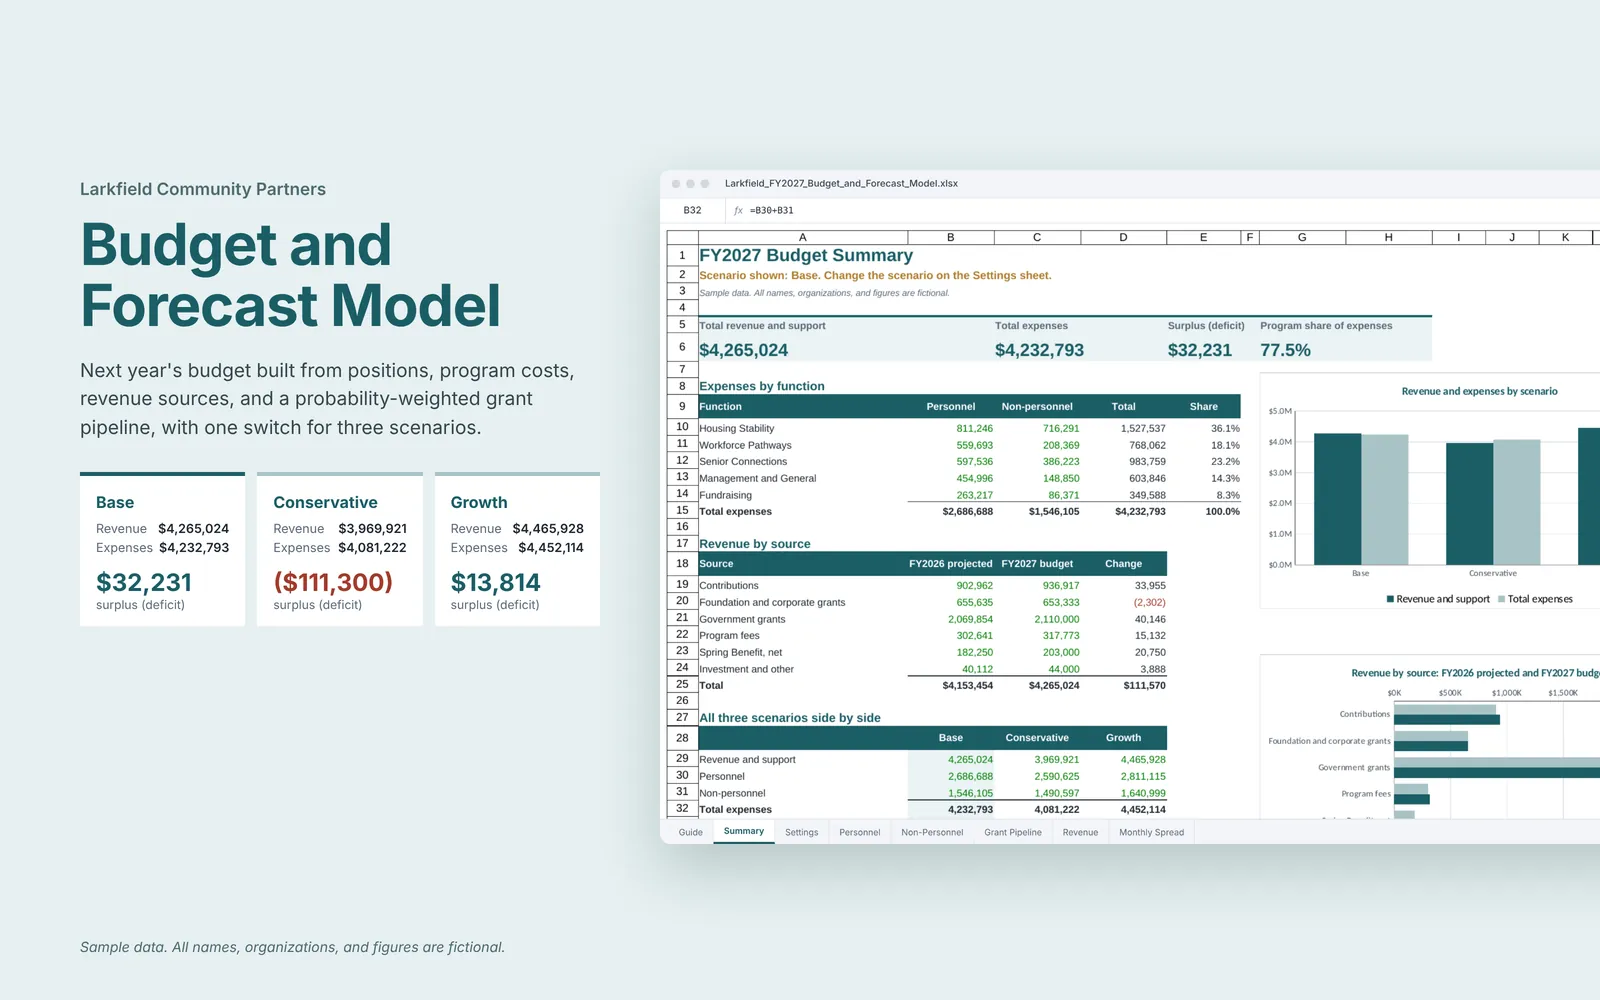
This Excel model builds a nonprofit's next-year budget from positions, program costs, and revenue sources. A single switch on the settings sheet moves the whole model between base, conservative, and growth scenarios.

Sample data. All names, organizations, and figures are fictional.

Budget and Forecast Model: Nonprofit budget model overviewOpen larger image

About this sample

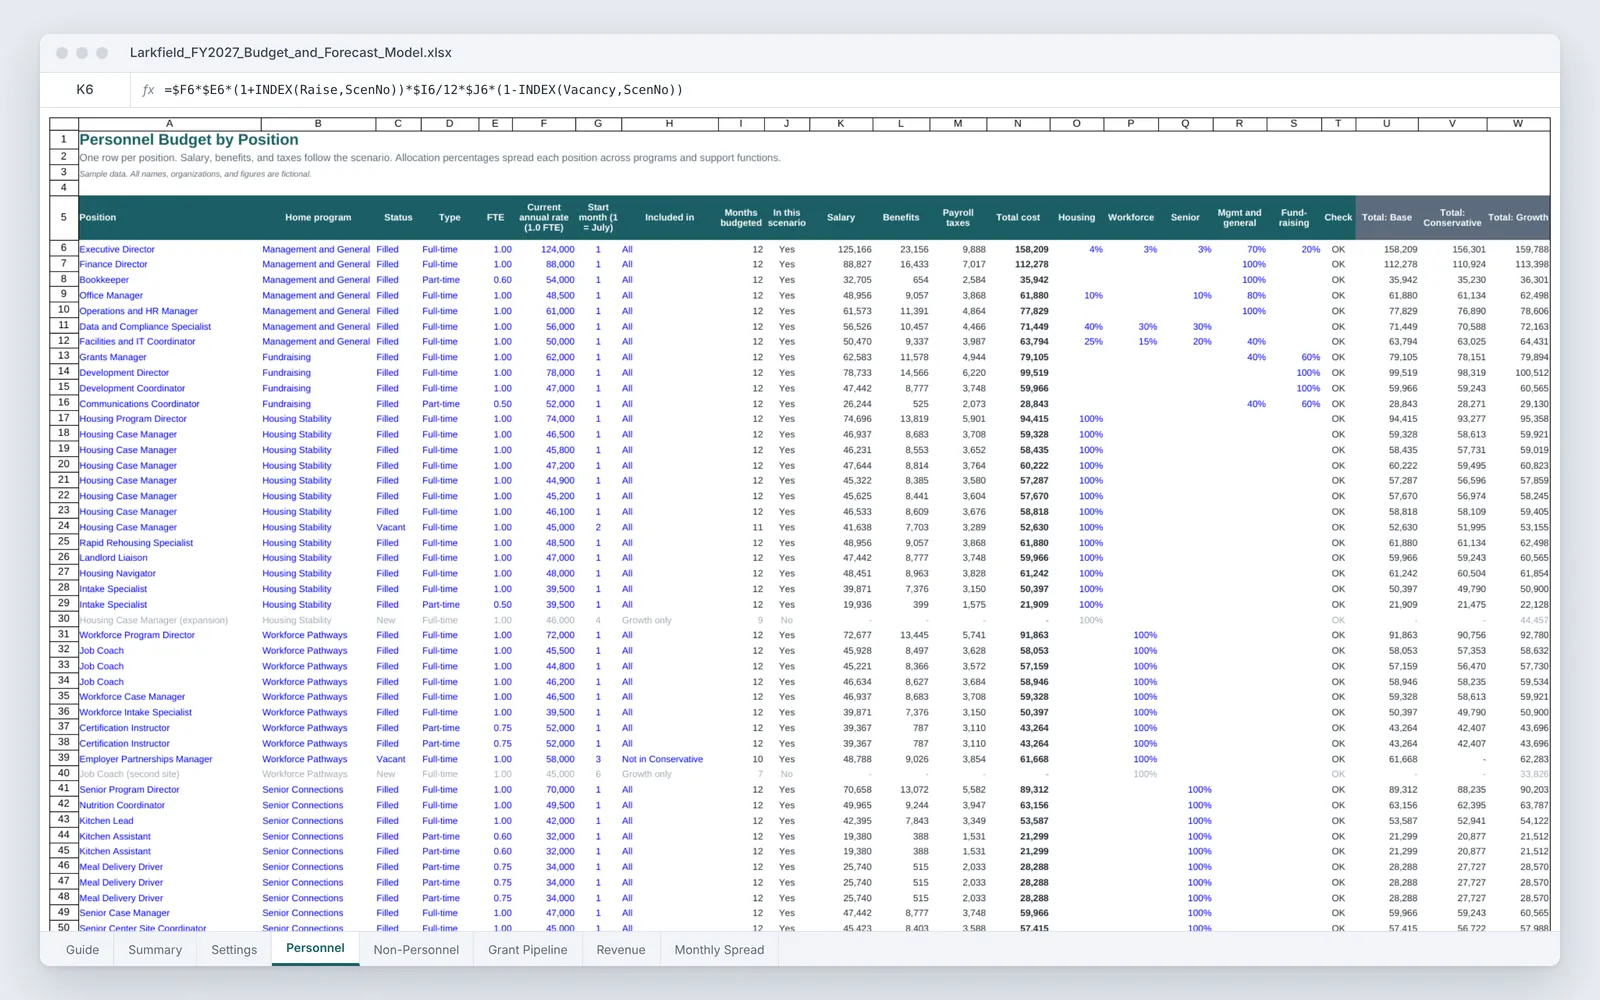
The model starts with a personnel sheet that lists every position with its FTE, current rate, start month, benefits, payroll taxes, and how its cost splits across programs and support functions. Non-personnel costs are entered by program and marked fixed, inflation, or volume, which decides how each line moves between scenarios, and shared costs are spread by FTE. Revenue comes from the current-year projection, government contract awards, the event plan, and a grant pipeline weighted by the probability of each stage.

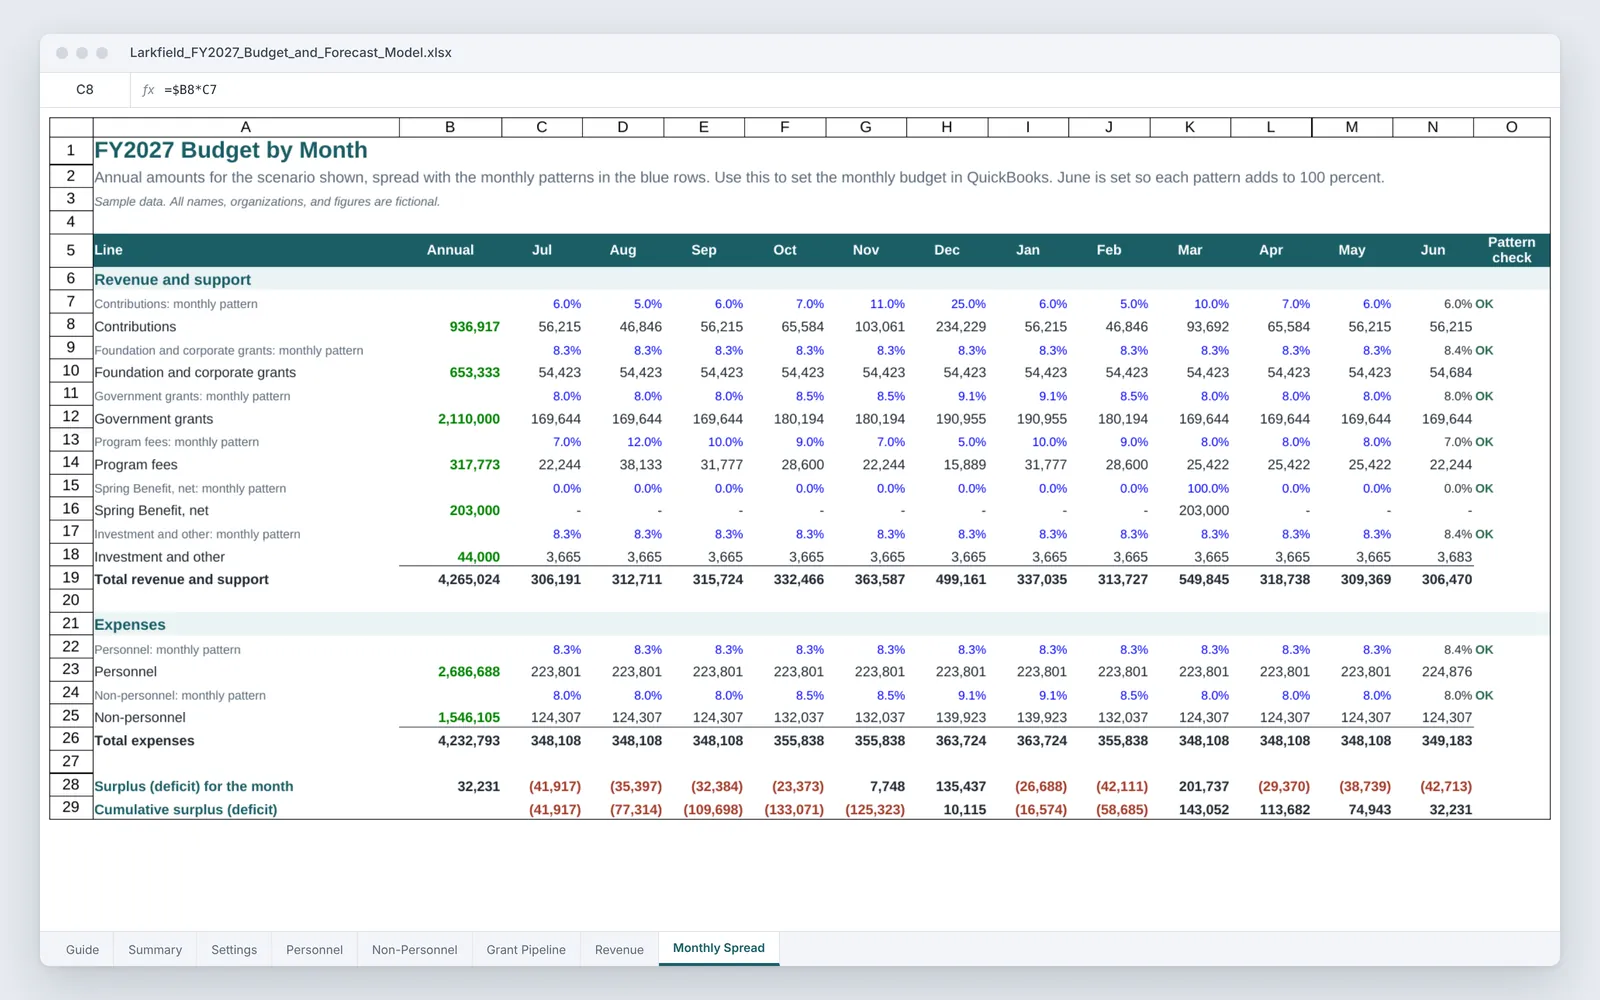
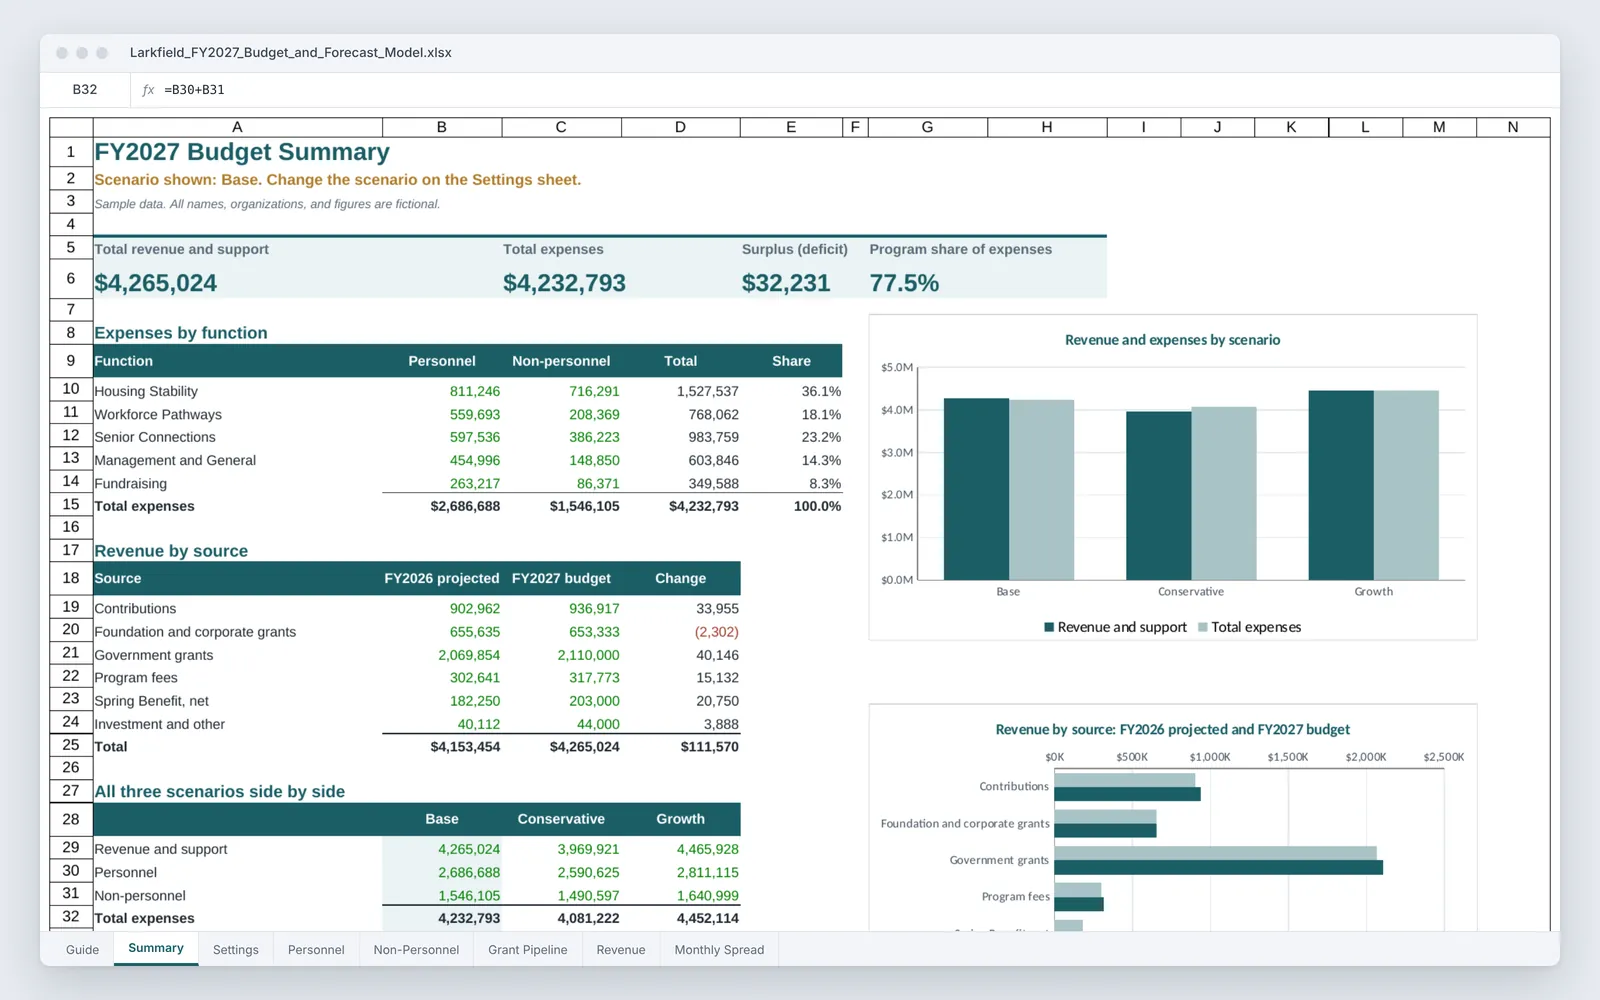
The summary shows the scenario chosen, expenses by function, revenue compared with the current-year projection, and all three scenarios side by side, with native Excel charts. A monthly spread turns the annual budget into the amounts a finance director would load into QuickBooks and shows the months when the budget runs a deficit, which helps with cash planning before the year starts.
What it includes

  • Position-level personnel budget with salary, benefits rate, payroll taxes, start month, and allocation across programs
  • Non-personnel expenses by program, with shared costs spread by FTE
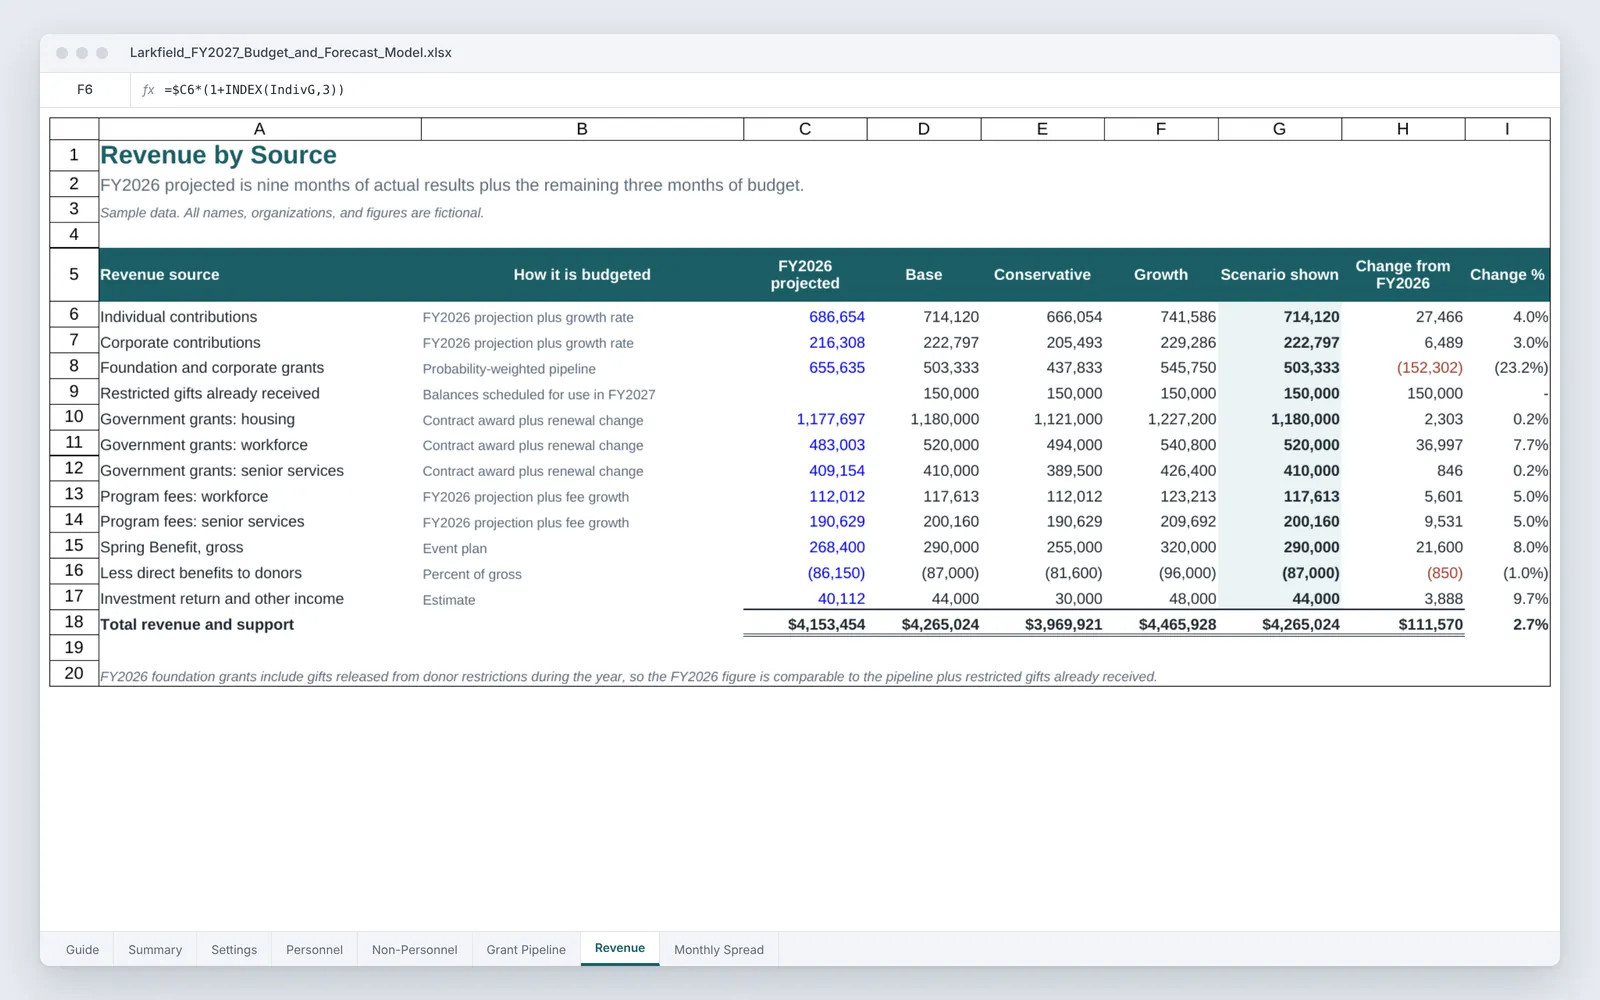
  • Revenue by source built from current-year projections and contract awards
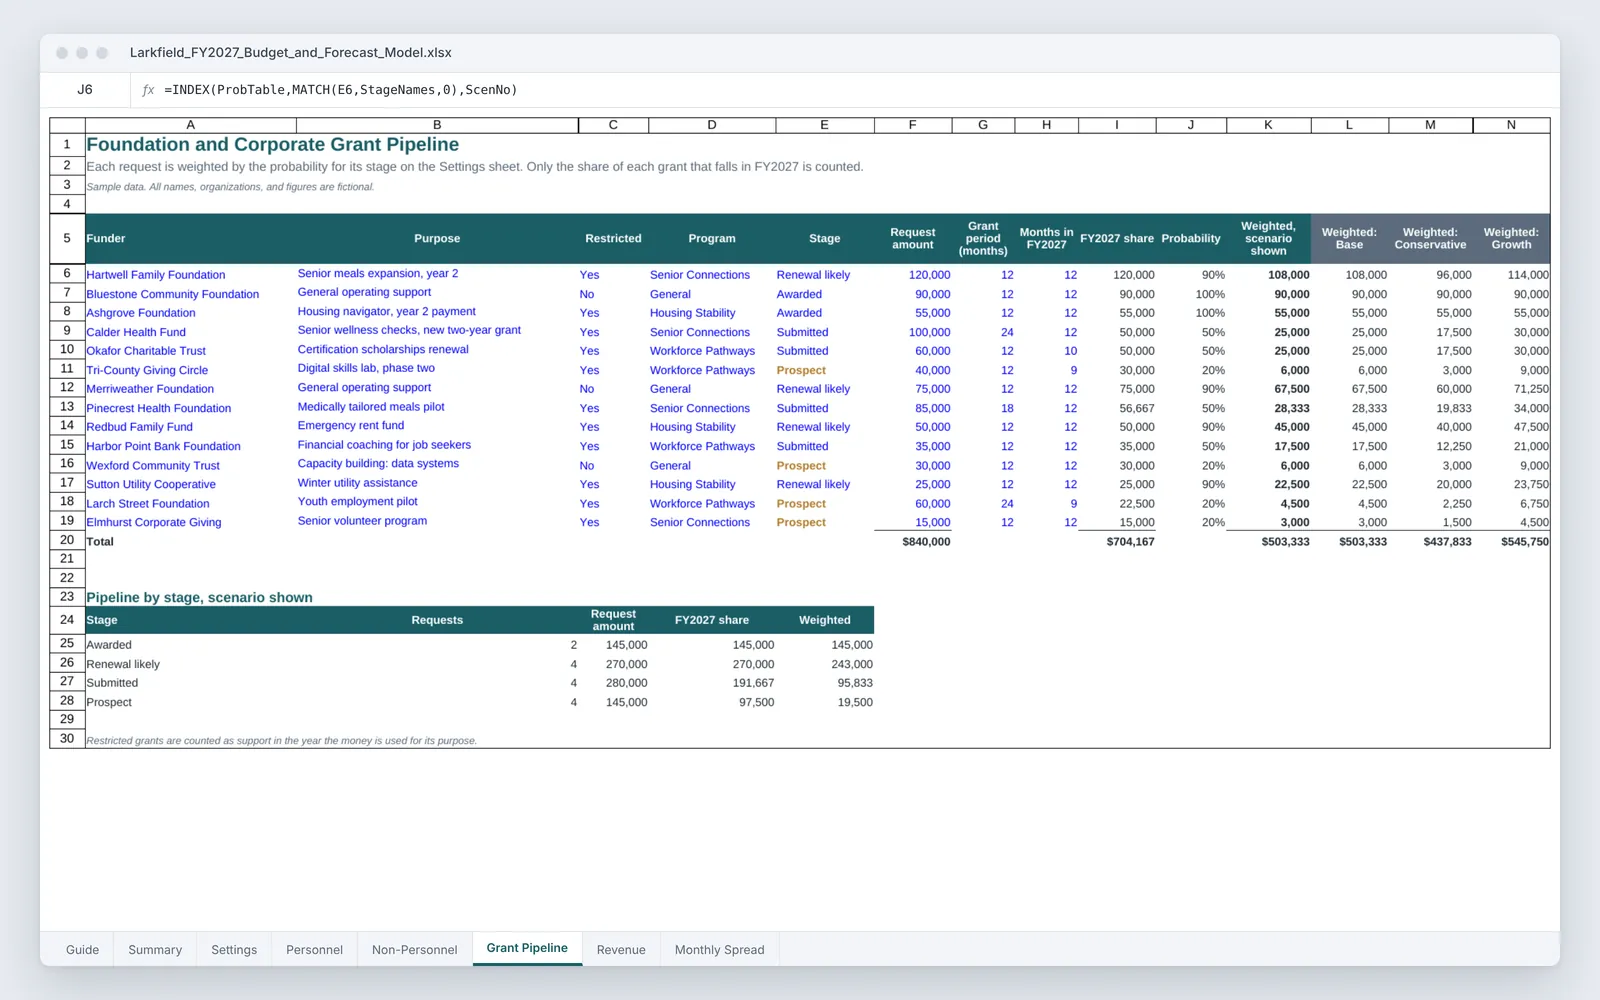
  • Grant pipeline weighted by stage probability, counting only the share that falls in the budget year
  • Base, conservative, and growth scenarios driven from one settings sheet
  • Summary with expenses by function, revenue comparison, and all three scenarios side by side
  • Monthly spread for loading the budget into QuickBooks

Screenshots

Select an image to see it larger.

More in Nonprofit Finance and Operations

Community Benefit Reporting Workbook

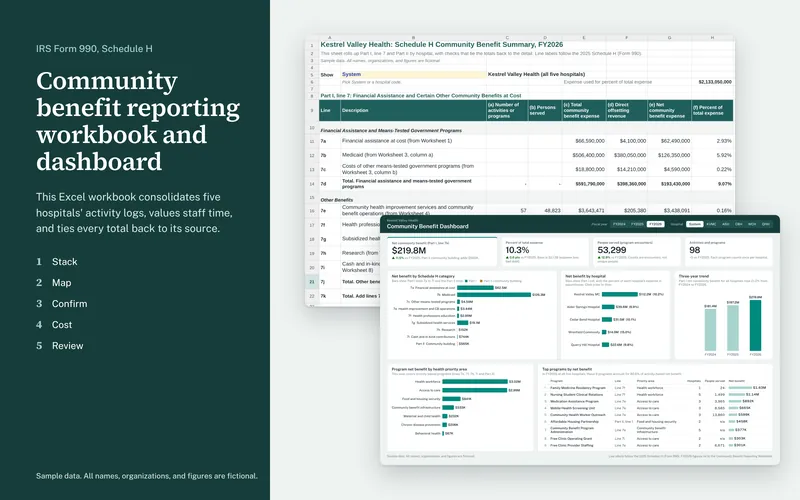
This Excel workbook consolidates five hospitals' community benefit activity logs into one dataset and rolls it up to the lines of IRS Form 990, Schedule H. Every total on the summary ties back through formulas to the row a hospital reported.

  • Excel
  • PDF report

Sample data

Community Benefit Dashboard

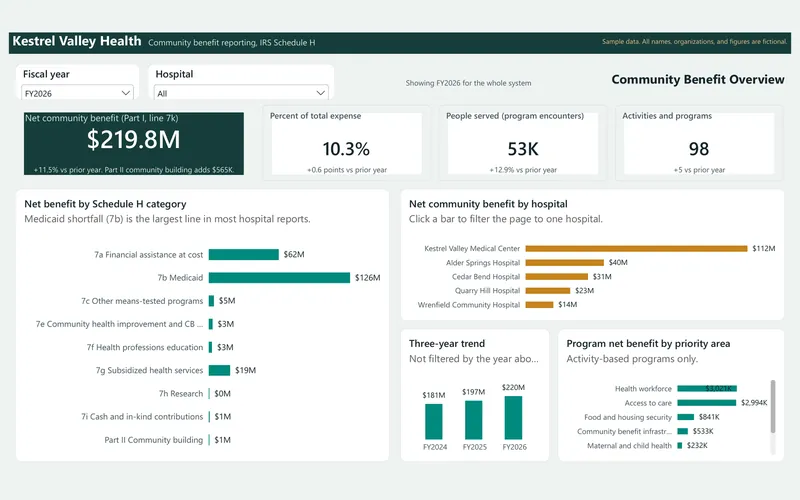
This interactive dashboard shows a hospital system's community benefit across three fiscal years, built from the same sample data as the reporting workbook. It comes with star-schema data files, a Power BI theme, and a rebuild guide with every DAX measure.

  • Power BI
  • Excel
  • PDF report

Sample data