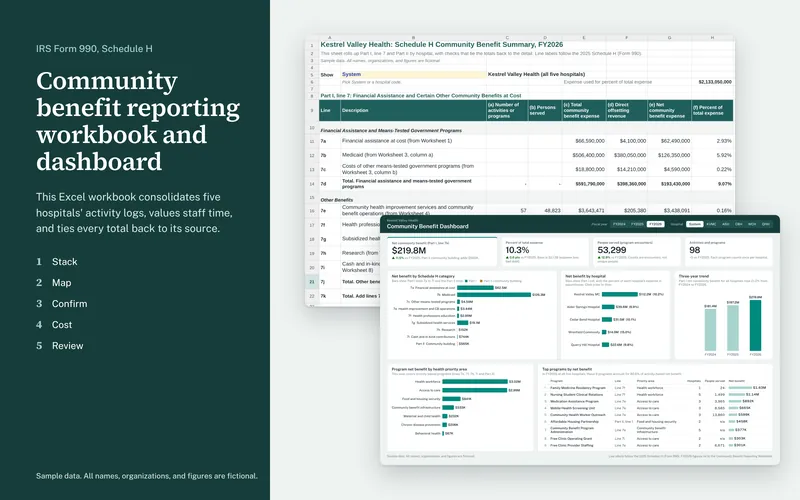
This Excel workbook consolidates five hospitals' community benefit activity logs into one dataset and rolls it up to the lines of IRS Form 990, Schedule H. Every total on the summary ties back through formulas to the row a hospital reported.
Sample data
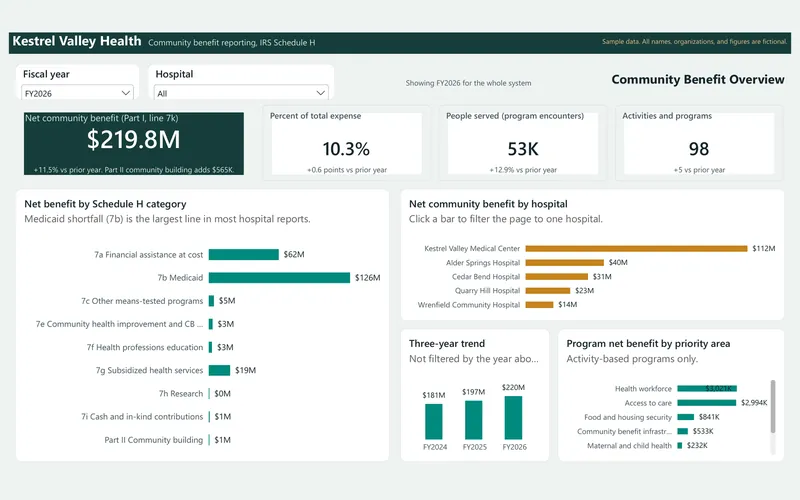
This interactive dashboard shows a hospital system's community benefit across three fiscal years, built from the same sample data as the reporting workbook. It comes with star-schema data files, a Power BI theme, and a rebuild guide with every DAX measure.
Sample data
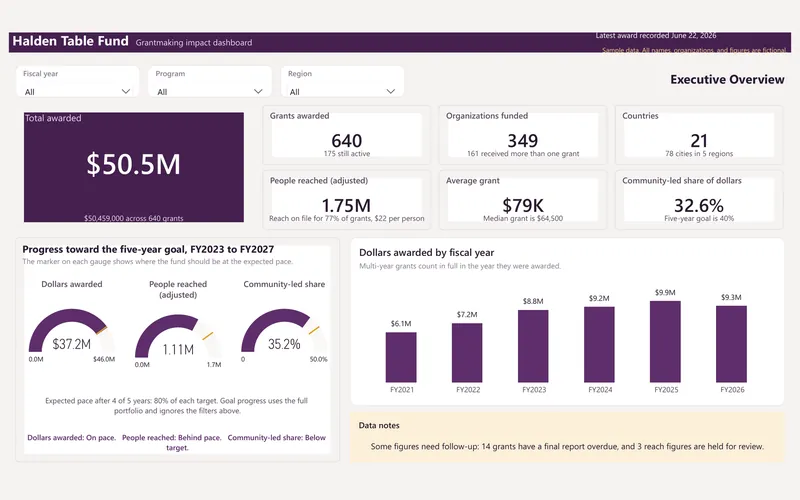
This is an executive dashboard for a corporate foundation's global grant program, covering six fiscal years, 640 grants, and $50.5 million in awards. It shows where the money went, who it reached, and how the fund is tracking against its five-year goal.
Sample data
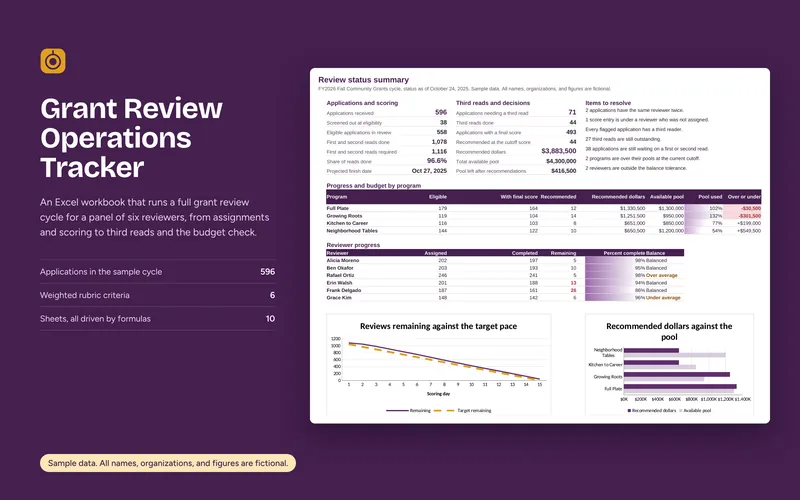
This is an Excel workbook for running a grant review cycle with a panel of six to eight reviewers. It tracks assignments, scores, daily pace, third reads, and whether recommended awards fit each program's budget.
Sample data
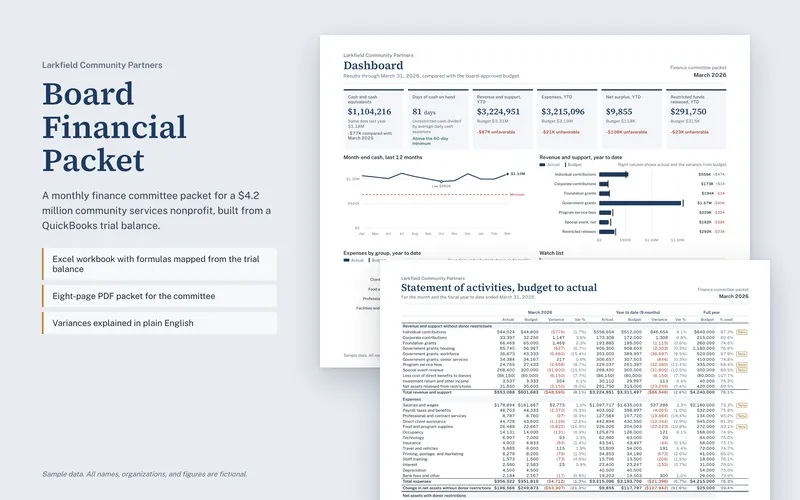
This is a monthly finance committee packet for a fictional $4.2 million community services nonprofit. The Excel workbook builds every report from a QuickBooks trial balance, and the matching eight-page PDF is what the committee reads.
Sample data
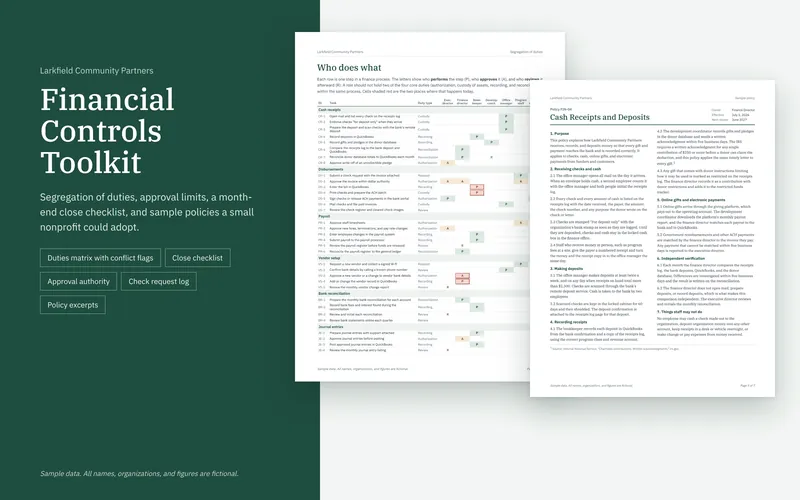
This toolkit gives a small nonprofit finance office a set of internal control tools: a segregation of duties matrix that flags conflicts, a month-end close checklist, an approval authority table, and a check request log that tests each payment. A short guide with two sample policies goes with it.
Sample data
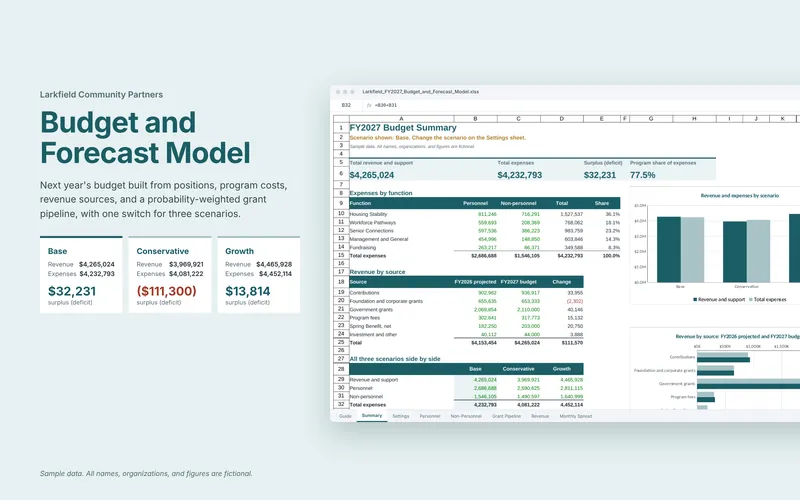
This Excel model builds a nonprofit's next-year budget from positions, program costs, and revenue sources. A single switch on the settings sheet moves the whole model between base, conservative, and growth scenarios.
Sample data
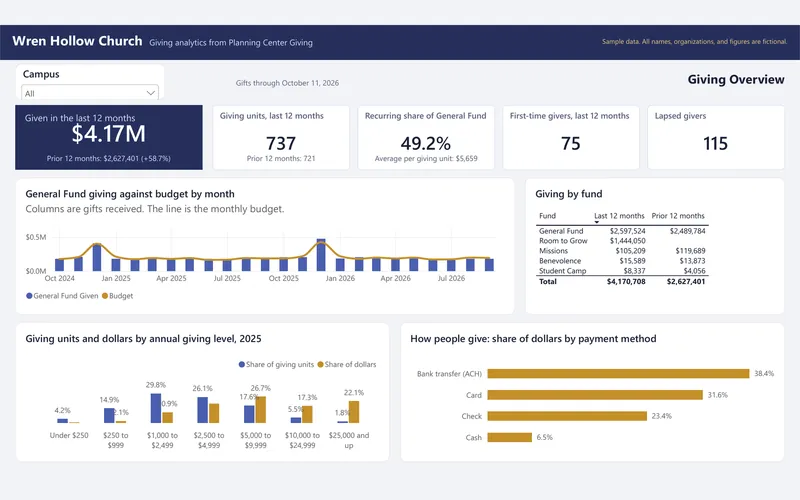
A four-page giving dashboard for a church finance team: giving units, recurring share, first-time and lapsed givers, giving bands, fund mix, monthly giving against budget, and a building campaign tracker. It comes with a Power BI rebuild kit that includes the data tables, a theme file, and every DAX measure.
Sample data
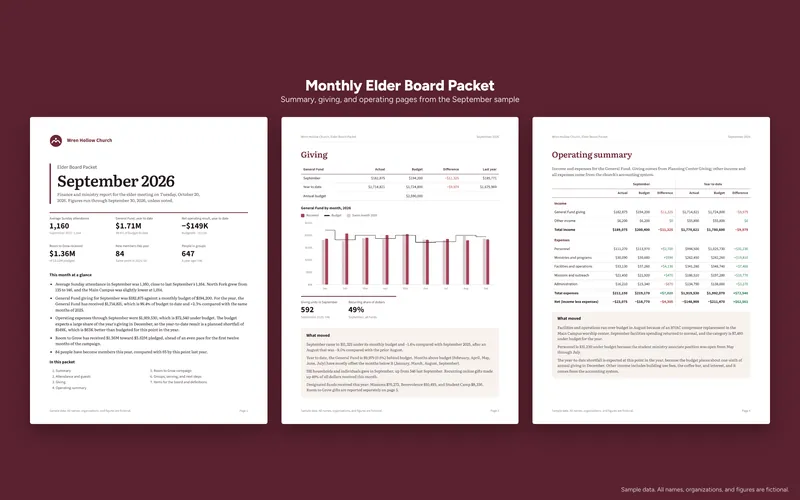
A seven-page monthly packet for an elder board that combines finance and ministry numbers: attendance, giving against budget, an operating summary, the building campaign, groups and serving, and items for discussion. Each page has a few plain sentences on what moved and why.
Sample data
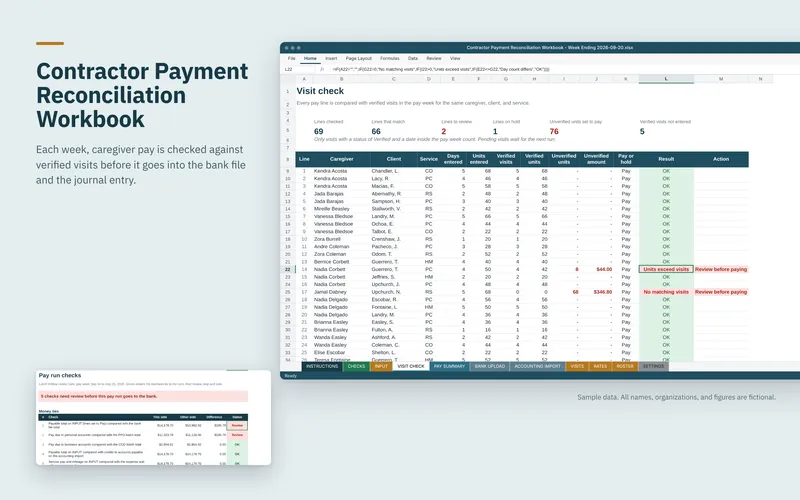
This Excel workbook is set up for a fictional in-home care agency that pays about 45 independent caregivers every week. It checks every pay line against verified visits, builds one bank file and one journal entry, and ties all three totals to the cent before money goes out.
Sample data
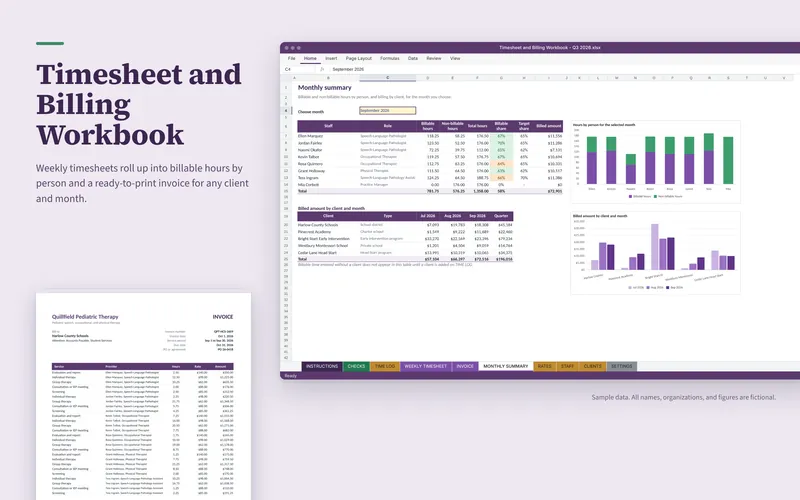
This Excel workbook is set up for a fictional pediatric therapy practice with eight staff. Staff log time by client and service code, and the workbook produces weekly timesheets, a monthly billable-hours summary with charts, and an invoice for any client and month.
Sample data
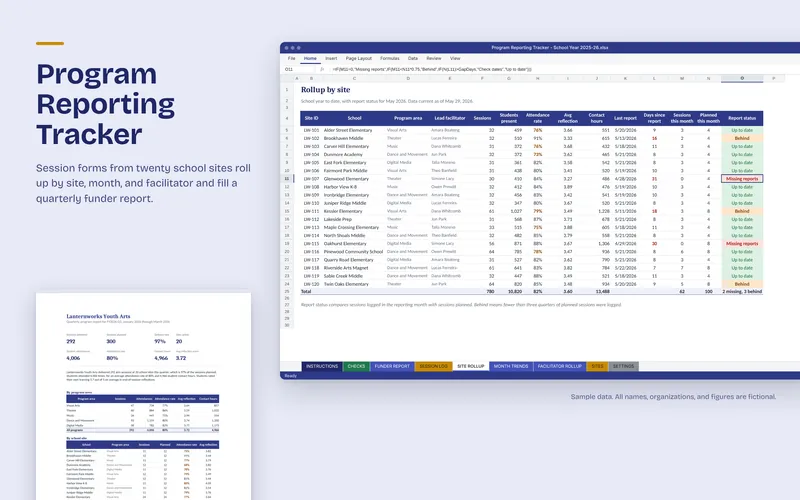
This Excel tracker is set up for a fictional youth arts nonprofit that runs programs at twenty school sites. Session form responses roll up by site, month, and facilitator, sites that have not reported are flagged, and a funder report fills itself for the quarter chosen.
Sample data