Dashboards and Business Intelligence

Timesheet and Billing Workbook

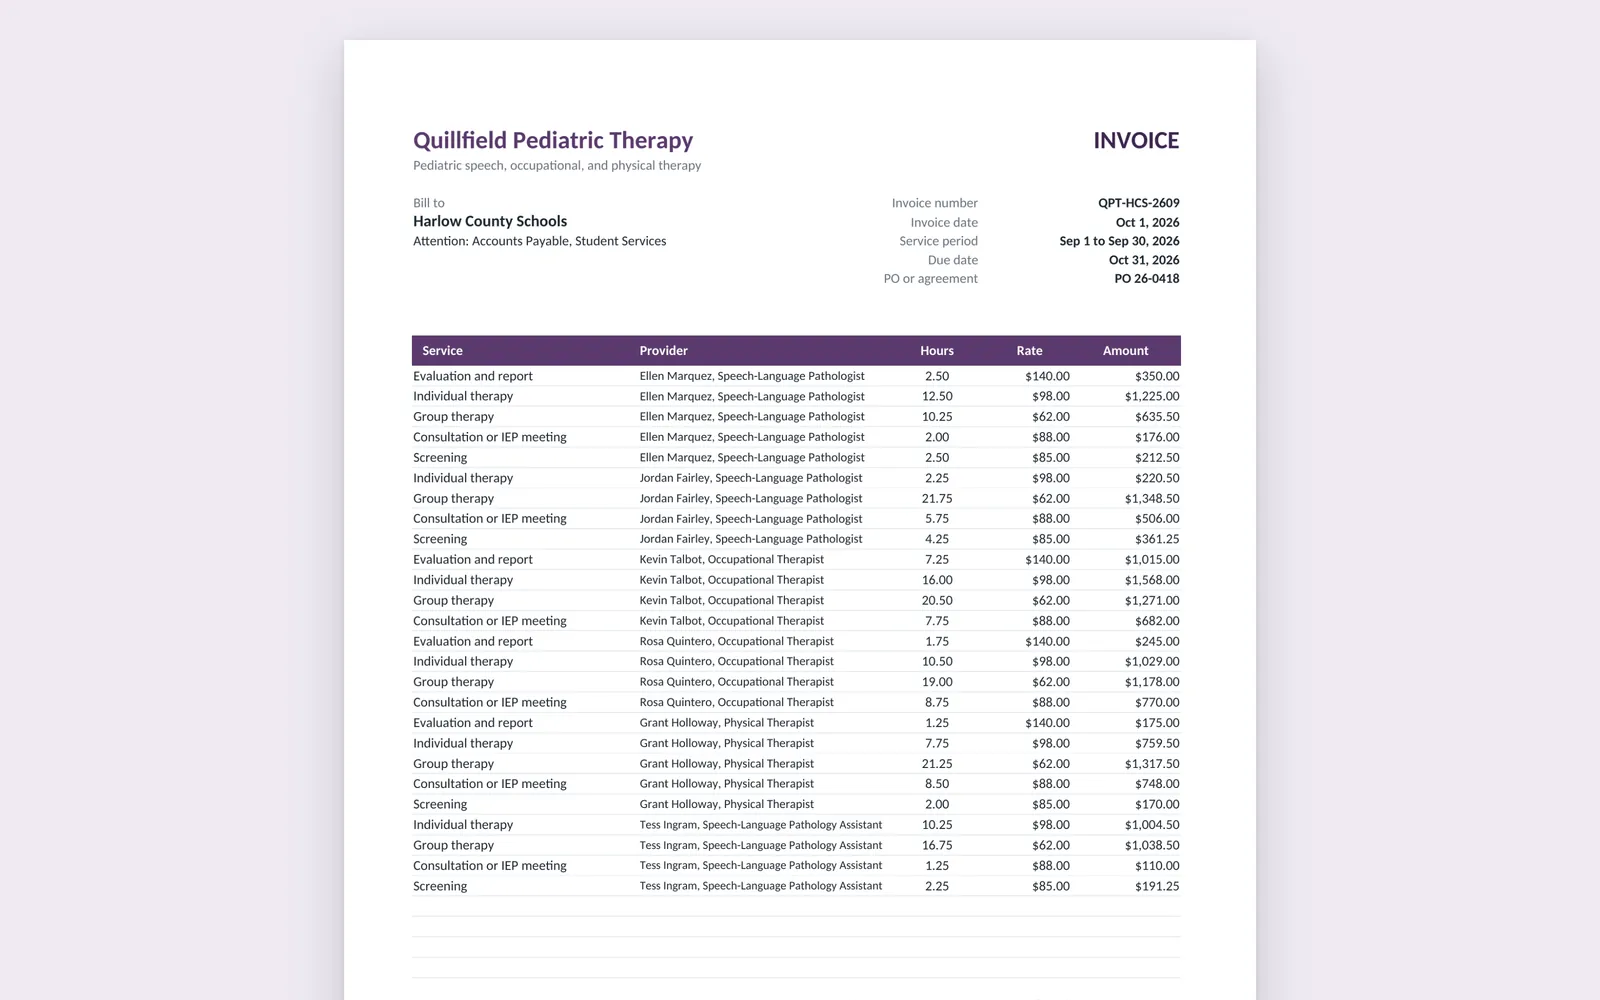
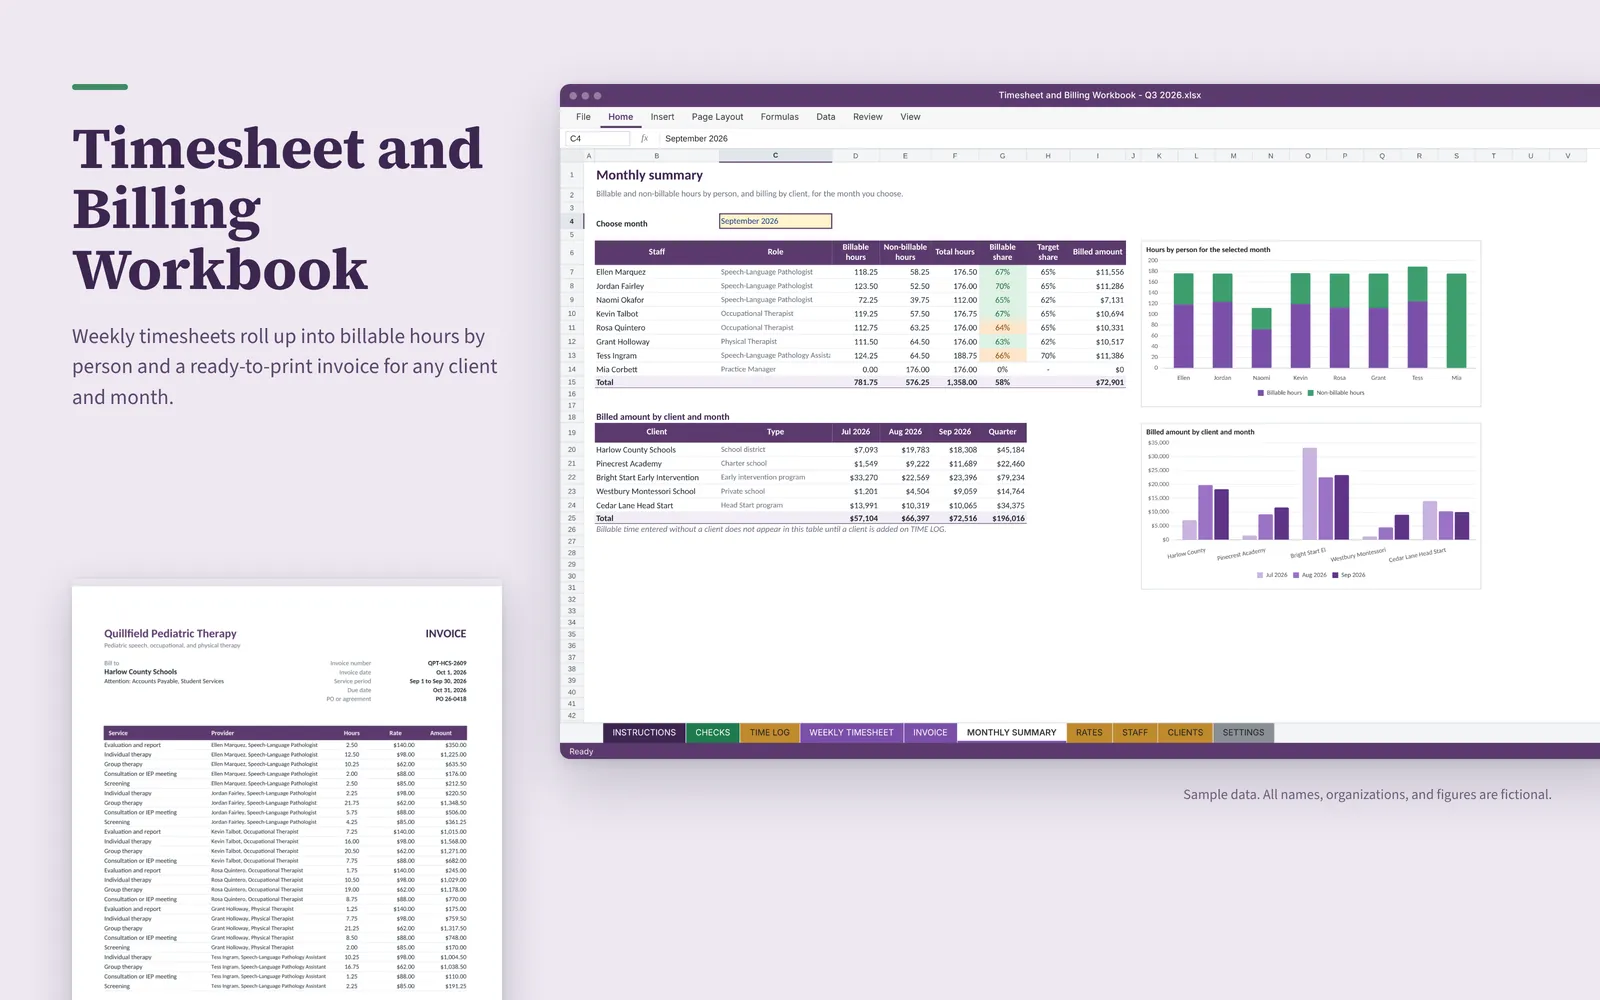
This Excel workbook is set up for a fictional pediatric therapy practice with eight staff. Staff log time by client and service code, and the workbook produces weekly timesheets, a monthly billable-hours summary with charts, and an invoice for any client and month.

Sample data. All names, organizations, and figures are fictional.

Timesheet and Billing Workbook: OverviewOpen larger image

About this sample

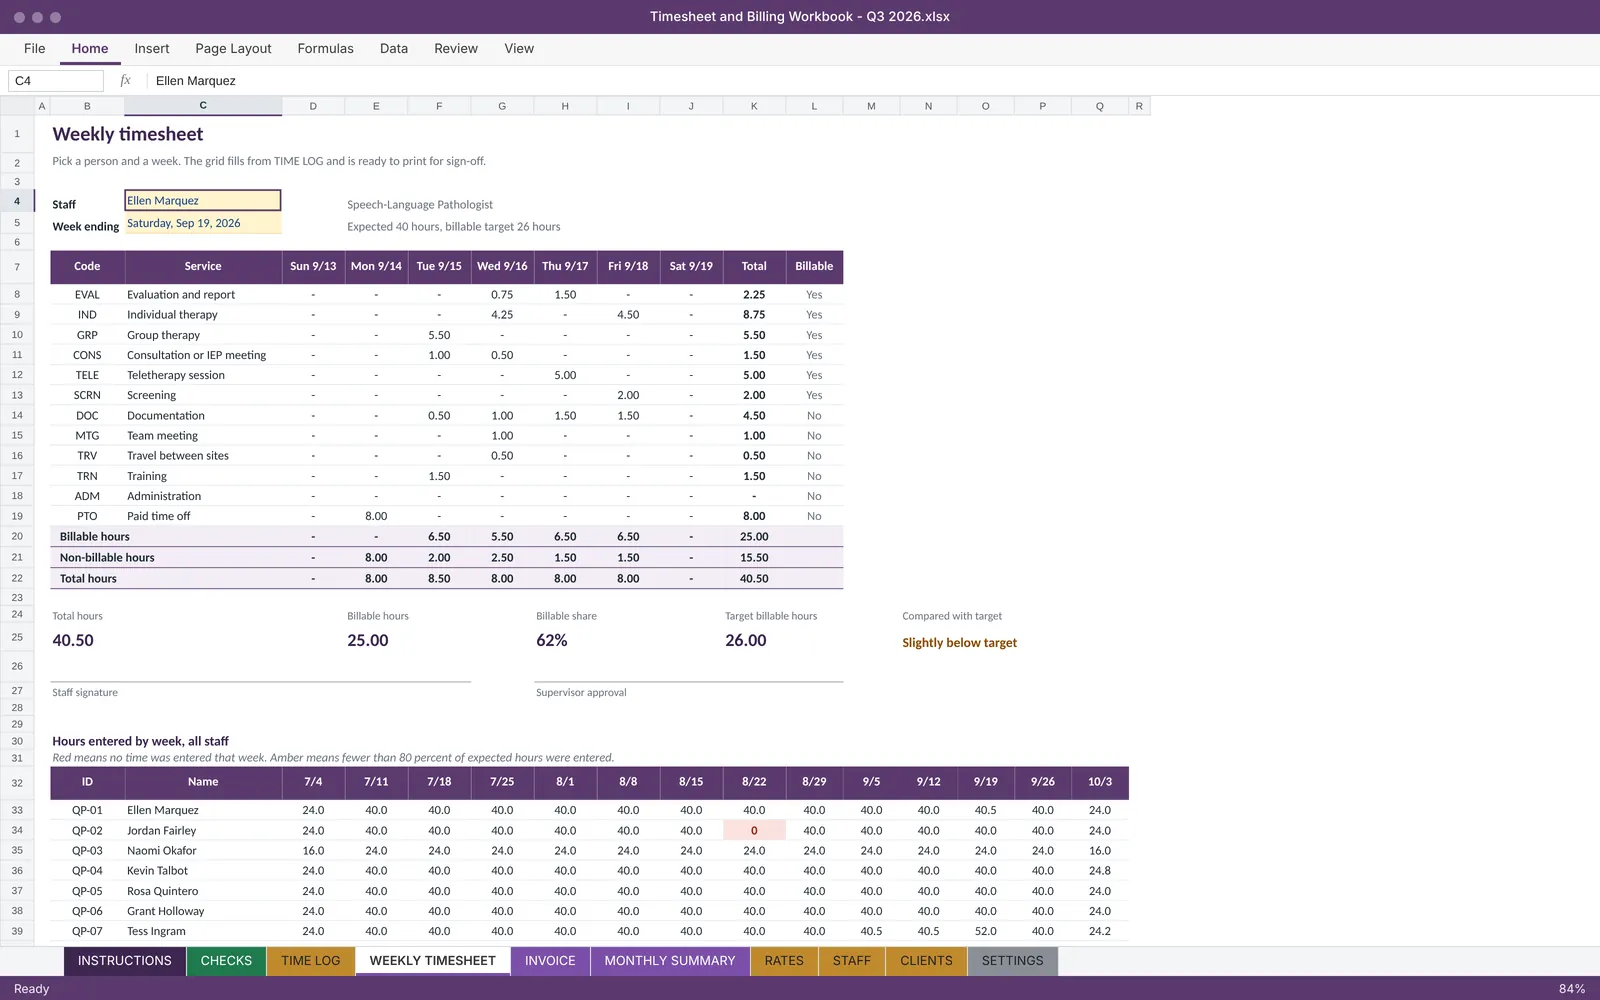
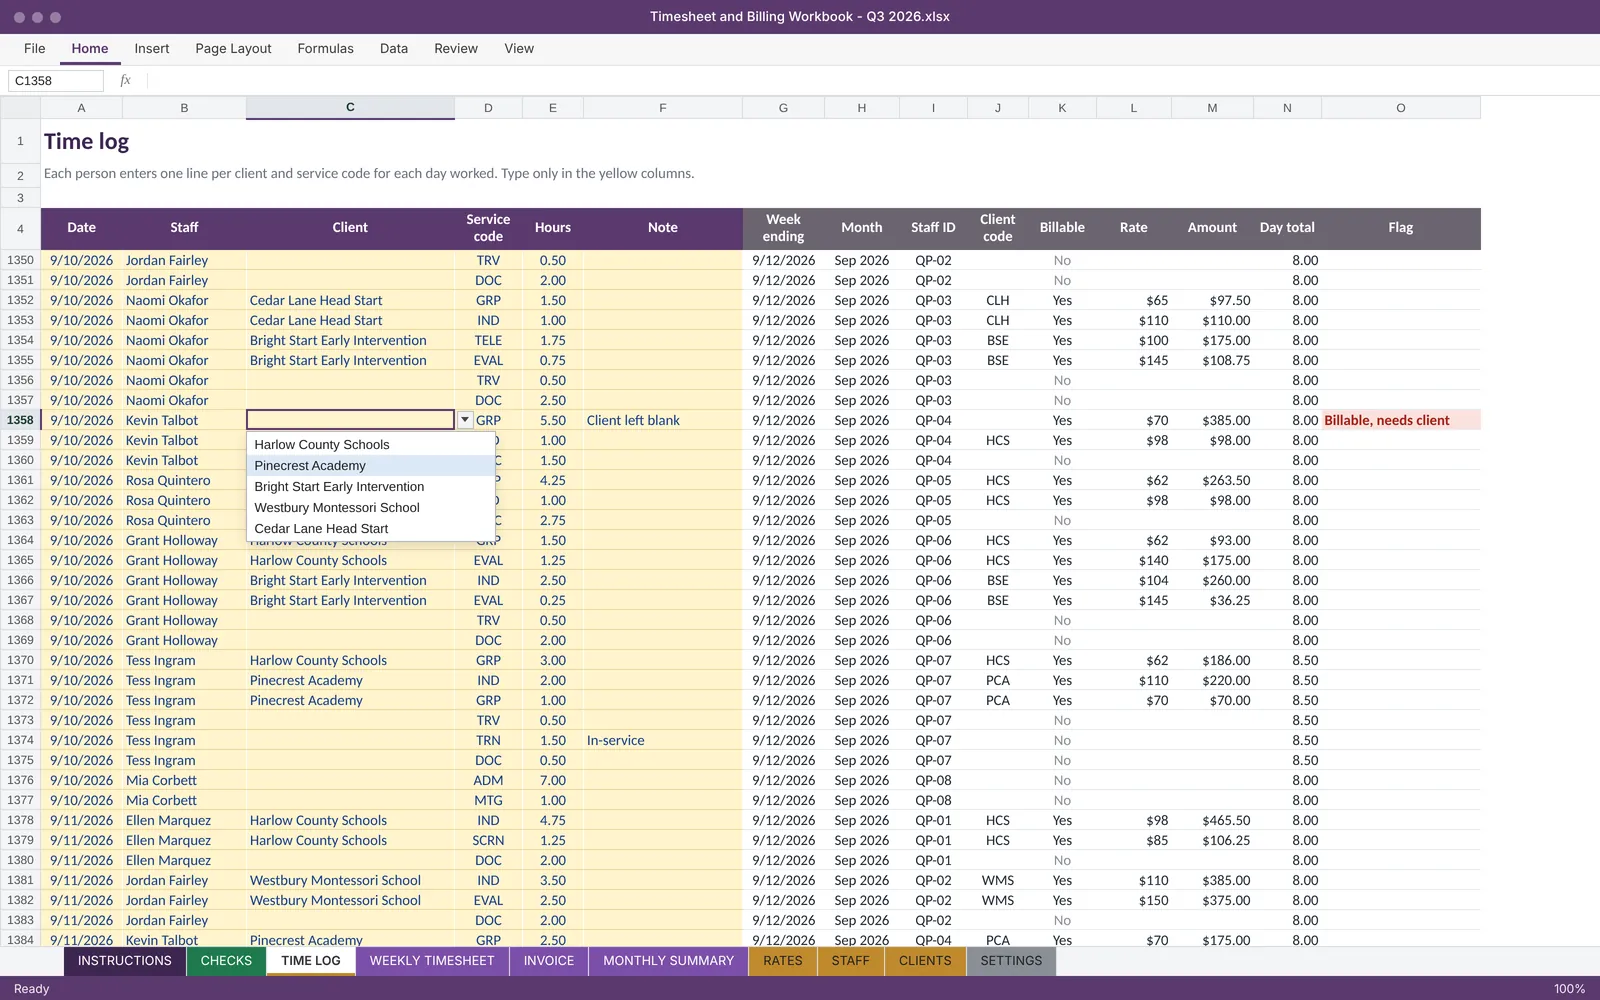
Each person enters time by day, client, and service code using drop-down lists. The workbook marks each code as billable or not, prices billable time at the standard rate or at a client's contract rate, and flags billable time with no client, days over the hour limit, and full weeks with no time entered. A weekly timesheet sheet shows one person's week by code and day, ready to print for sign-off, with a grid of hours by week for the whole staff.

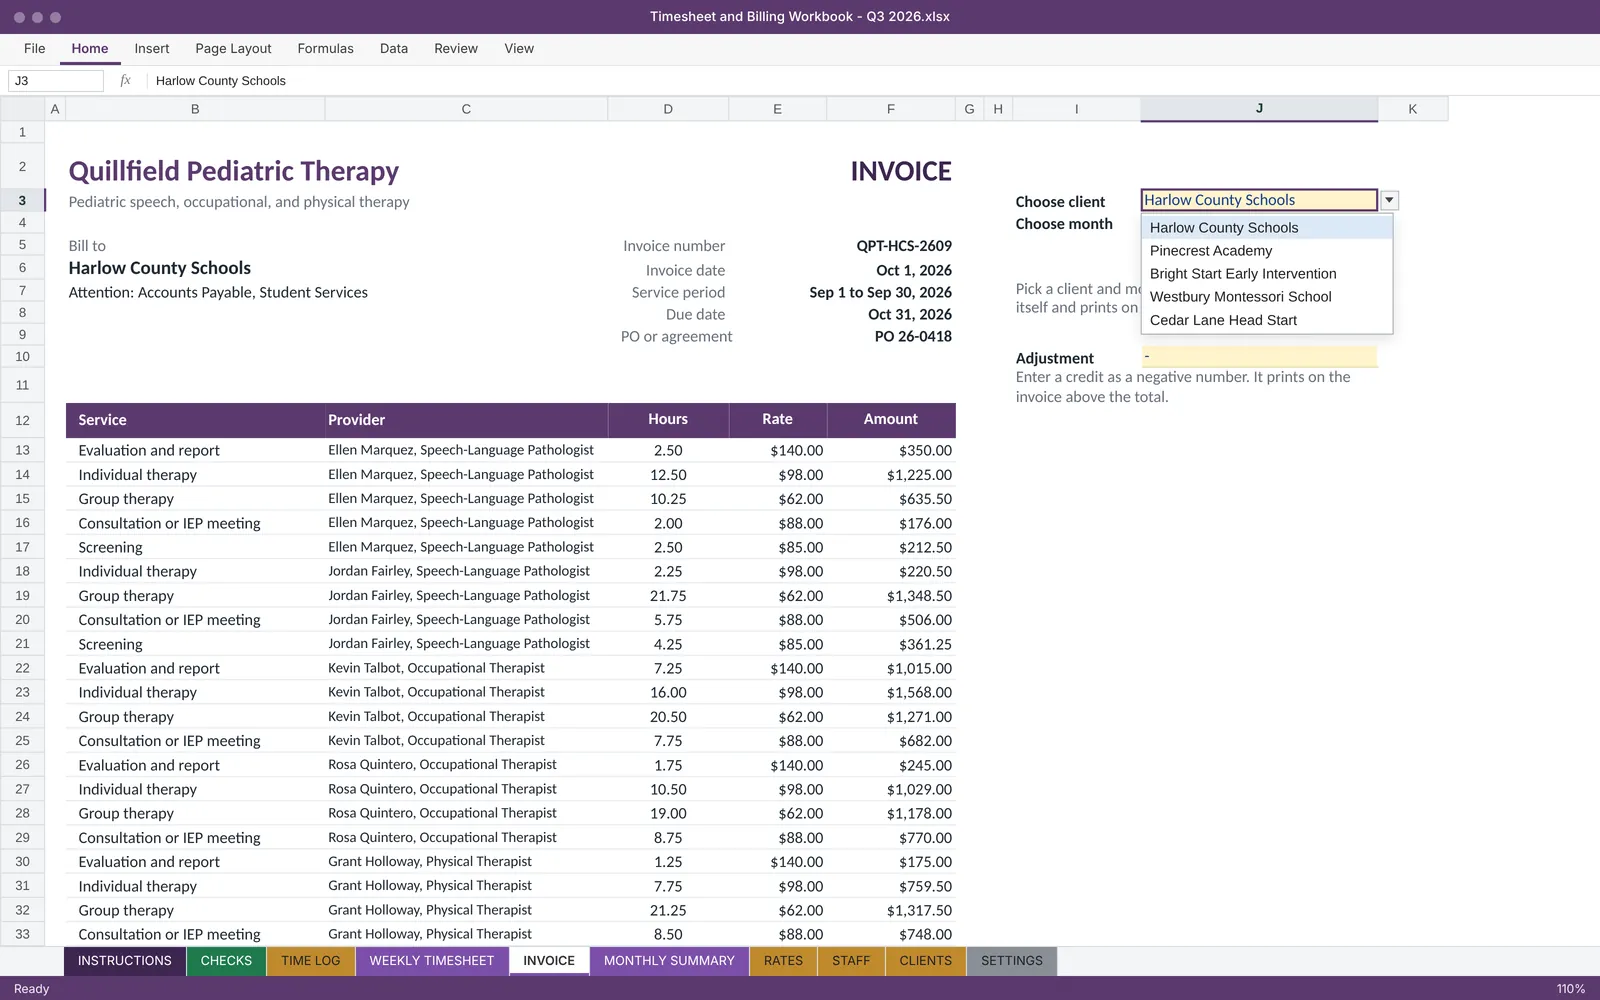
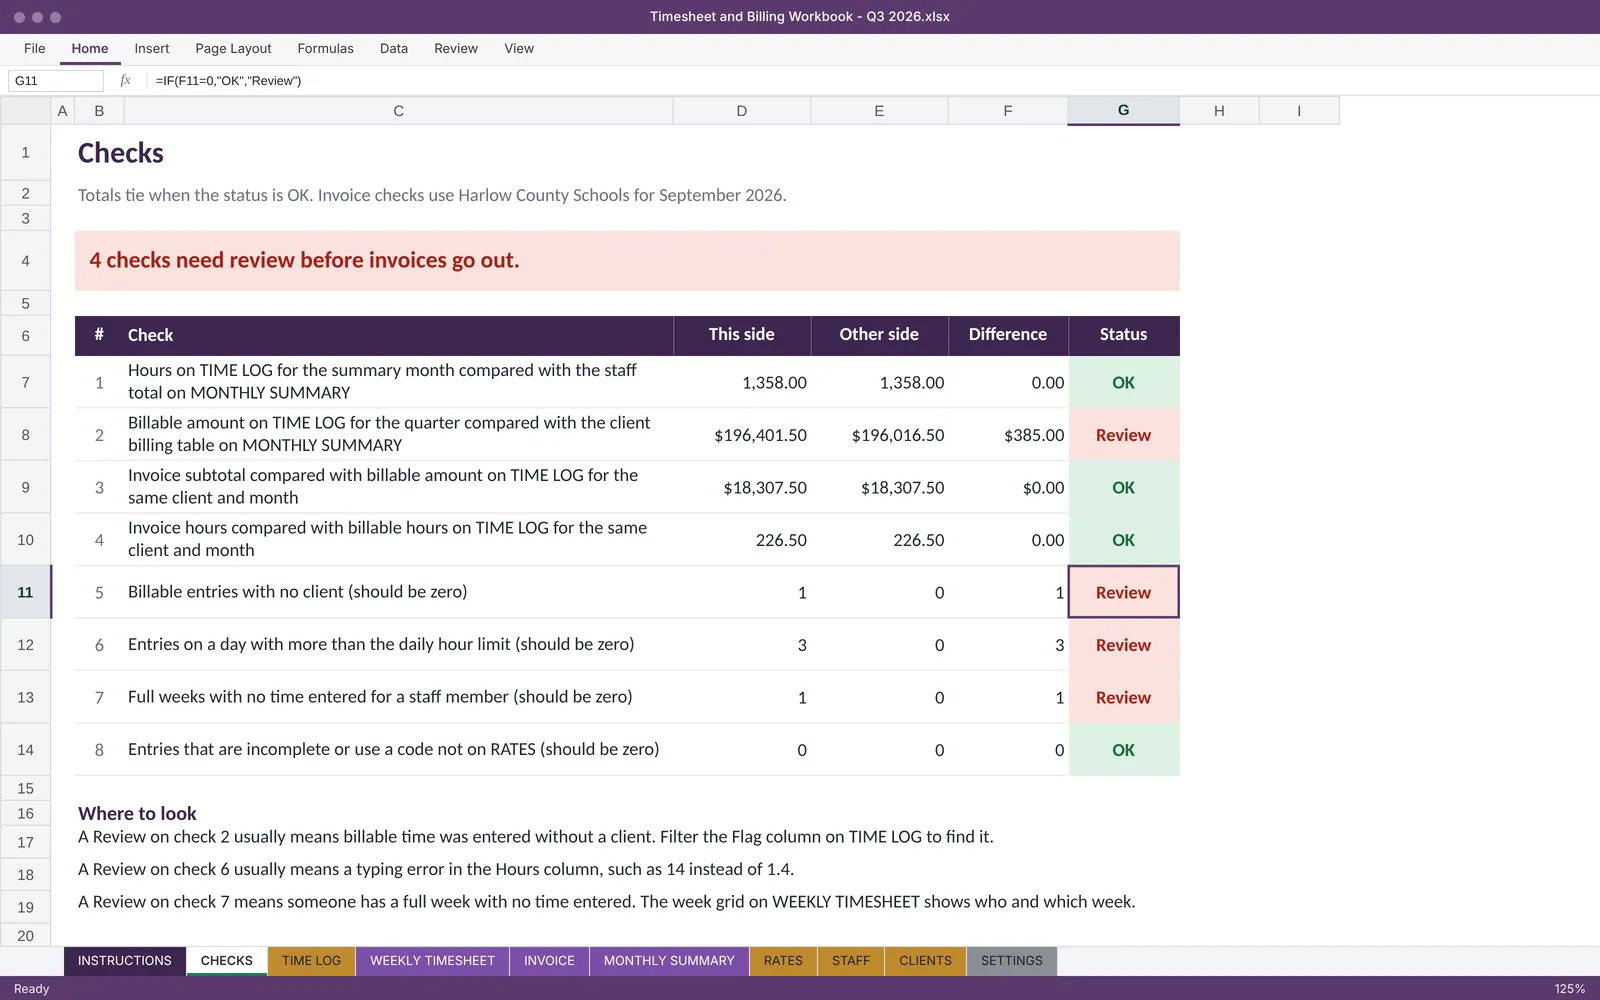
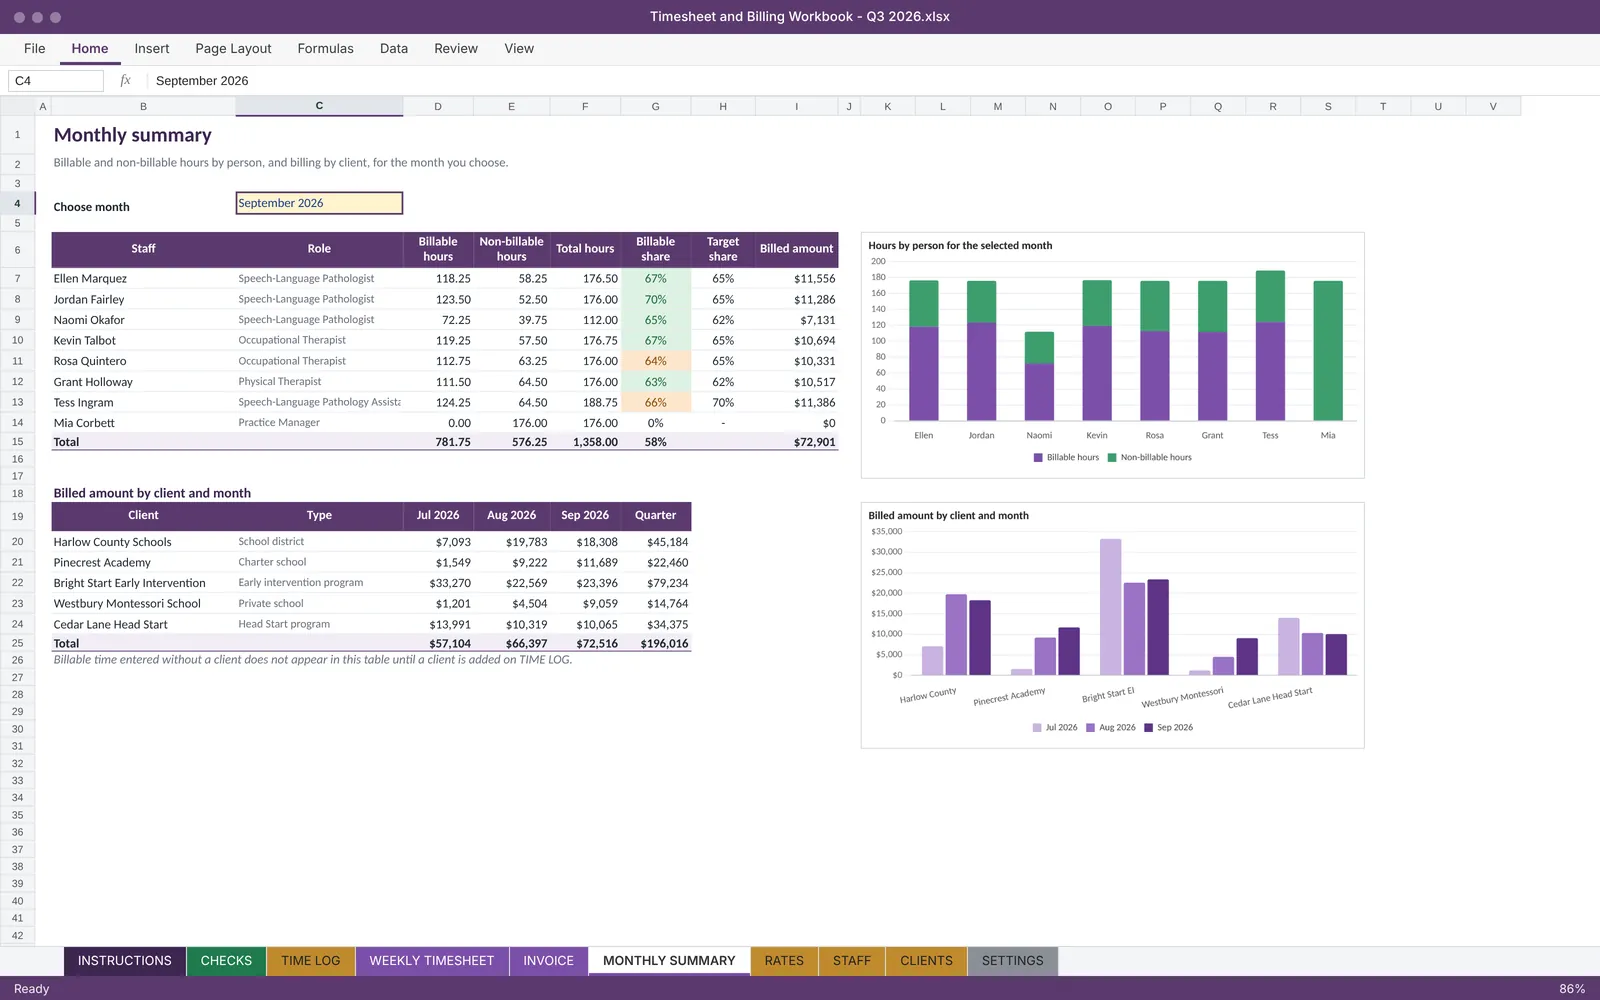
The monthly summary compares each person's billable share with their target and charts hours by person and billing by client and month using native Excel charts. The invoice sheet groups hours by provider and service for the client and month chosen, and the checks sheet confirms that the invoice, the summary, and the time log agree.
What it includes

  • Daily time log with drop-down staff, client, and service codes
  • Standard rates with client contract rates that override them
  • Printable weekly timesheet plus an all-staff week grid that flags missing weeks
  • Monthly summary of billable and non-billable hours with two native charts
  • Invoice that fills itself for any client and month and prints on one page
  • Checks sheet that ties invoice, summary, and time log totals
  • Protected formulas, yellow input cells, and plain-English instructions

Screenshots

Select an image to see it larger.

More in Dashboards and Business Intelligence

County Health Profile: Upstate South Carolina

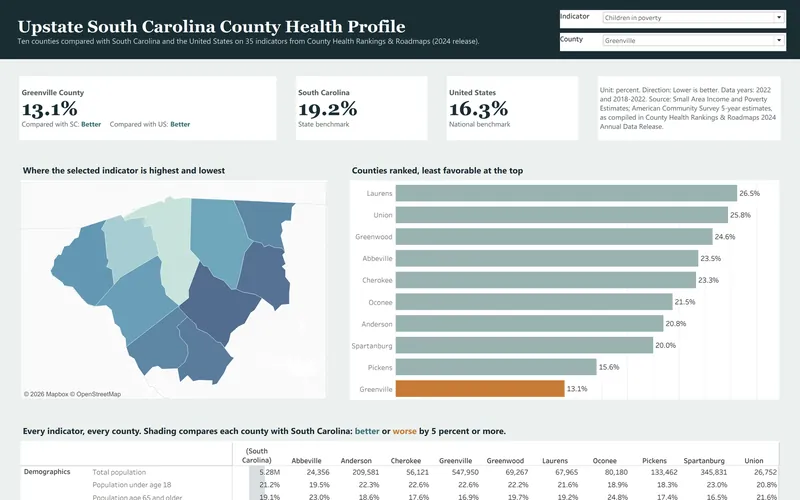
This is the secondary data profile from a community health needs assessment for ten Upstate South Carolina counties, and it is built from the 2024 County Health Rankings release. It compares 35 county indicators with state and national values and turns them into a dashboard, a 14-page report and an Excel workbook.

  • Excel
  • Tableau
  • PDF report

Public data

Community Health Survey Results

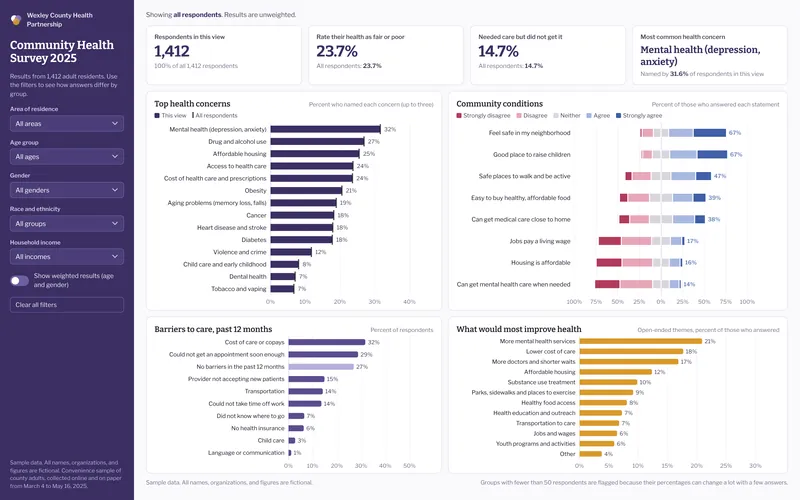
This sample analyzes a fictional county community health survey with 1,412 respondents, which is the kind of survey hospitals run as part of a community health needs assessment. It includes a filterable dashboard, an 8-page results brief and an Excel workbook with crosstabs, a codebook and weighting.

  • Excel
  • Power BI
  • PDF report

Sample data