Dashboards and Business Intelligence

Contractor Payment Reconciliation Workbook

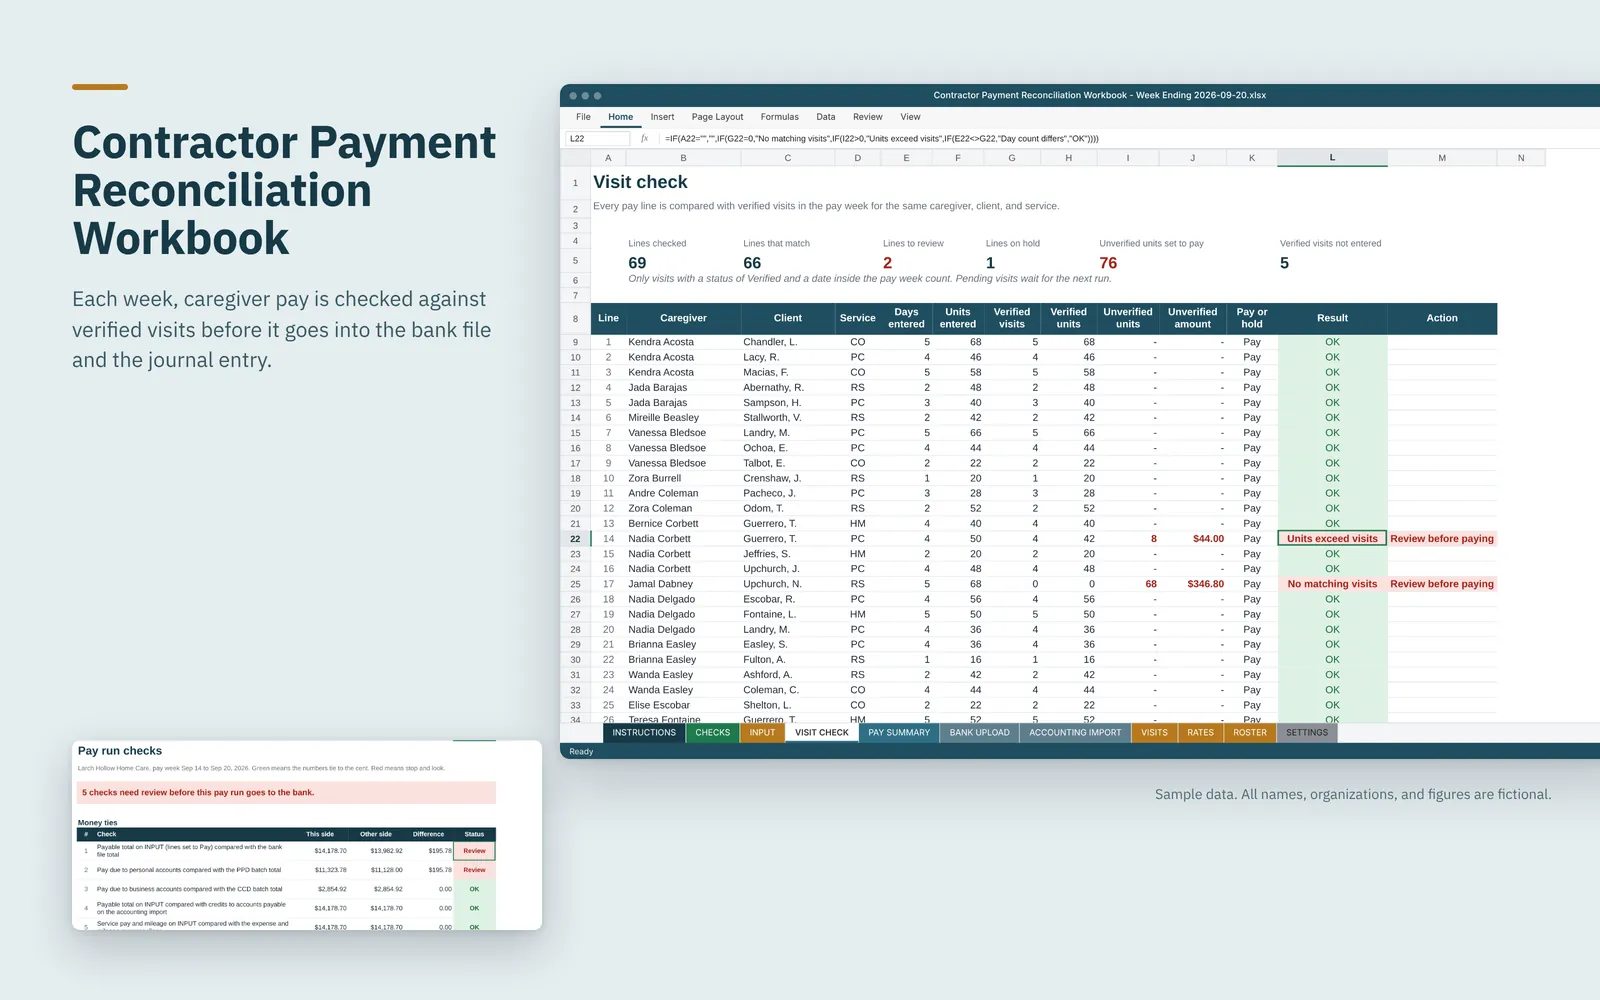
This Excel workbook is set up for a fictional in-home care agency that pays about 45 independent caregivers every week. It checks every pay line against verified visits, builds one bank file and one journal entry, and ties all three totals to the cent before money goes out.

Sample data. All names, organizations, and figures are fictional.

Contractor Payment Reconciliation Workbook: OverviewOpen larger image

About this sample

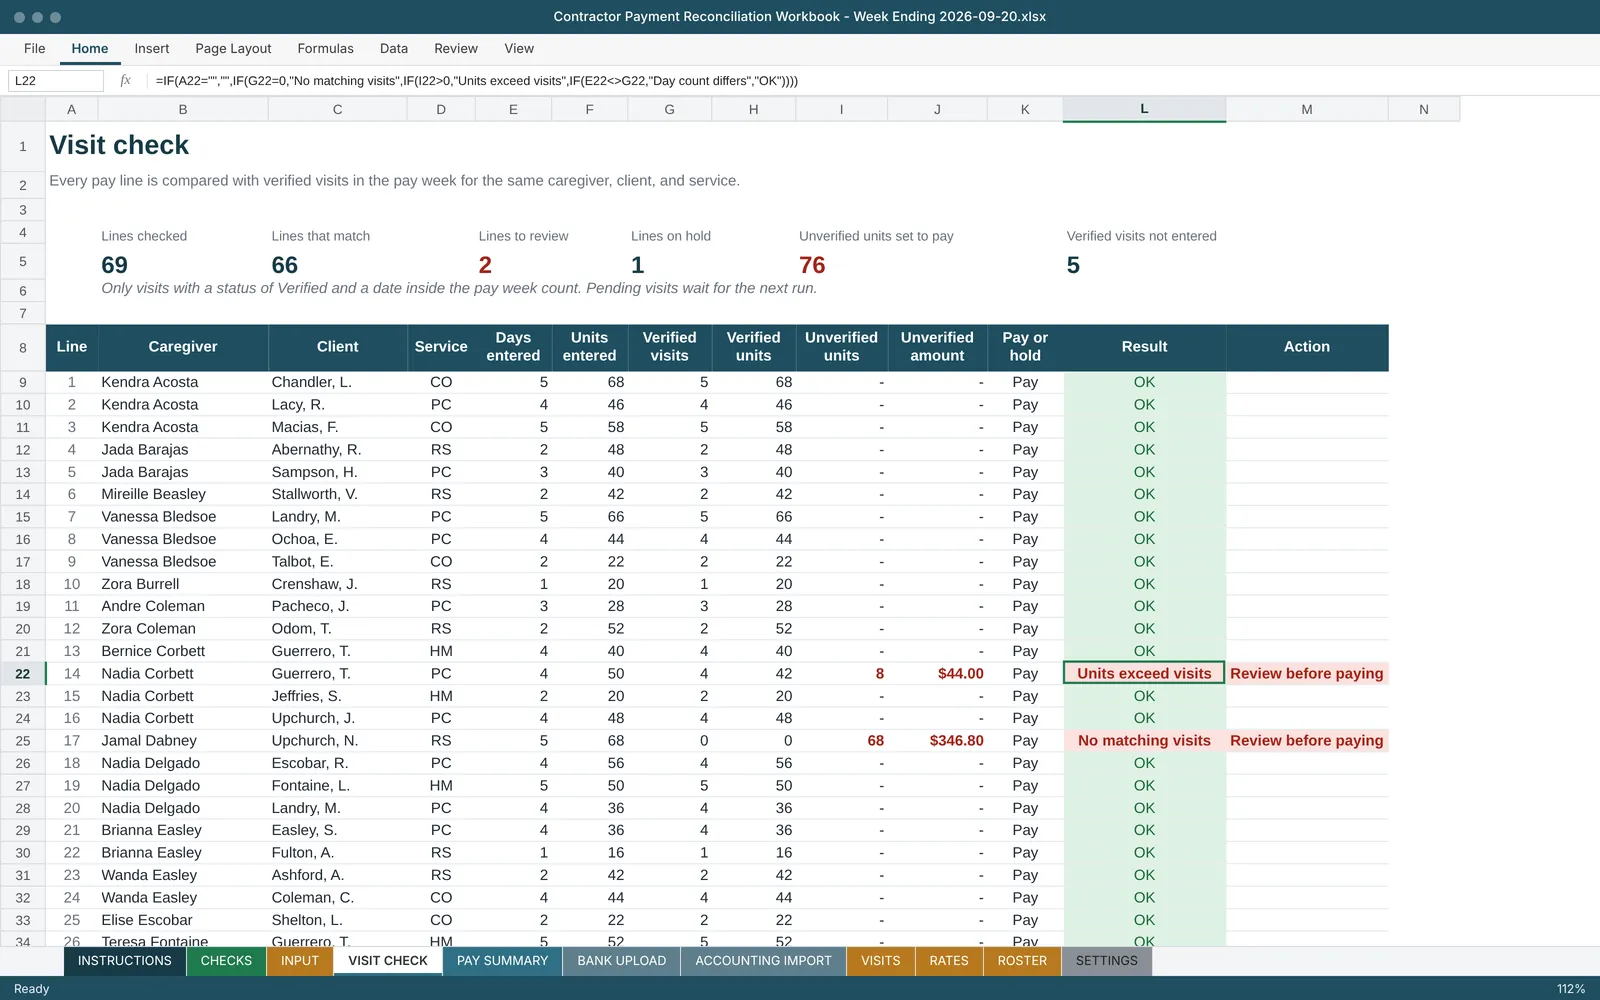
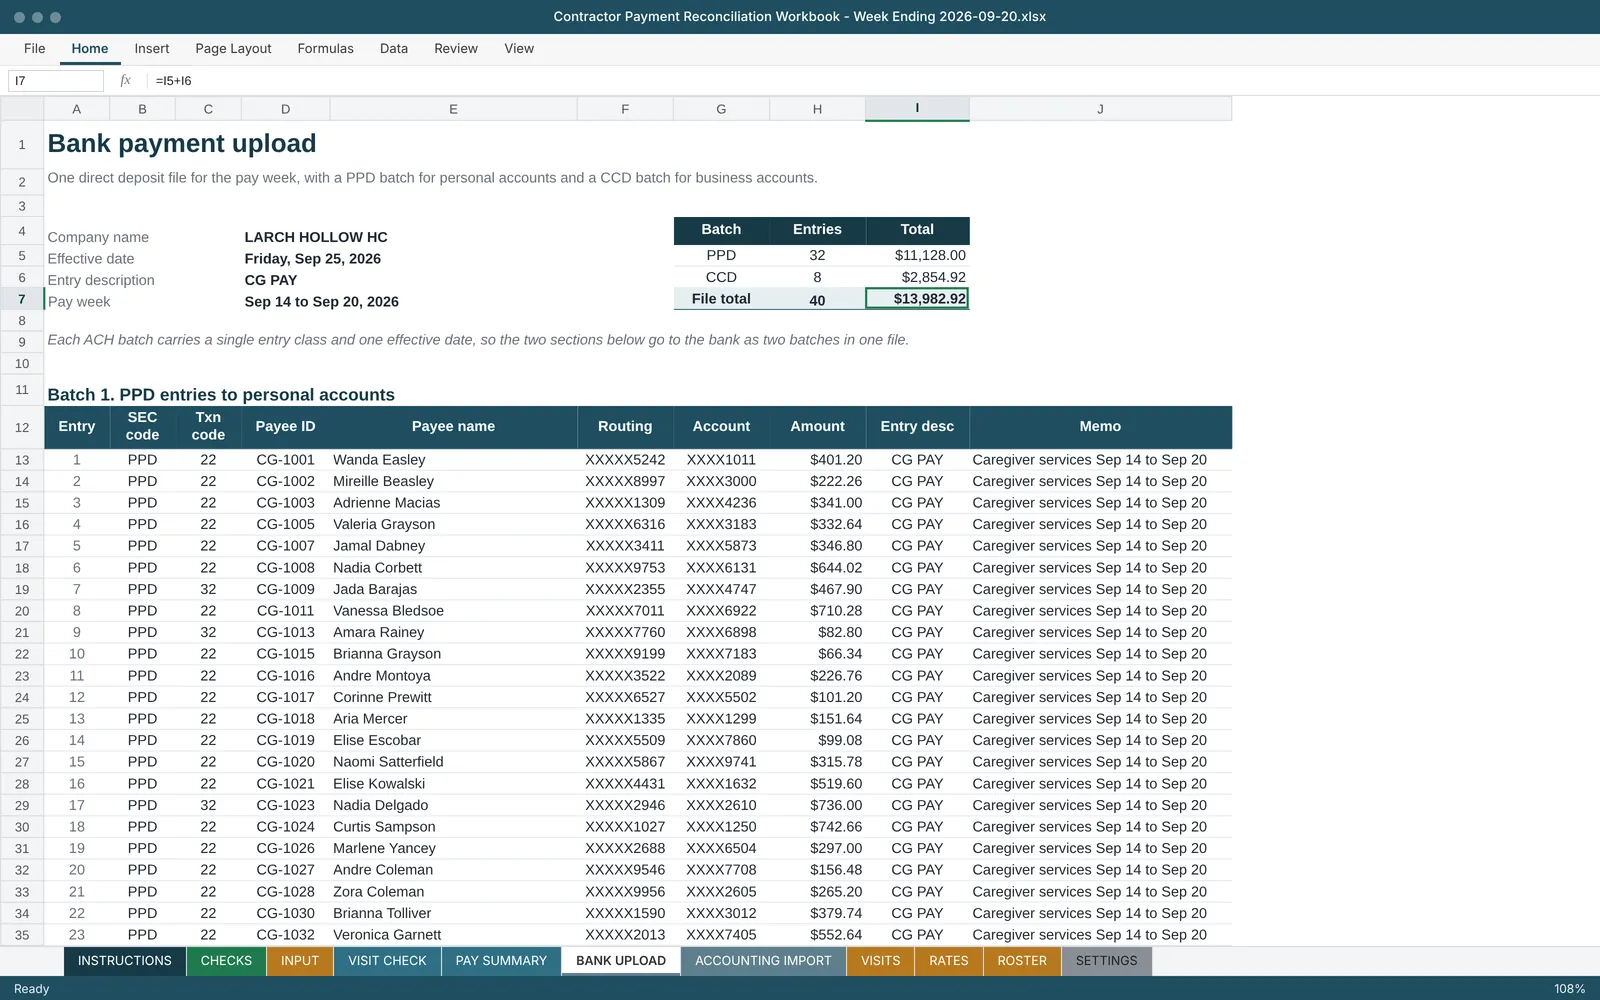
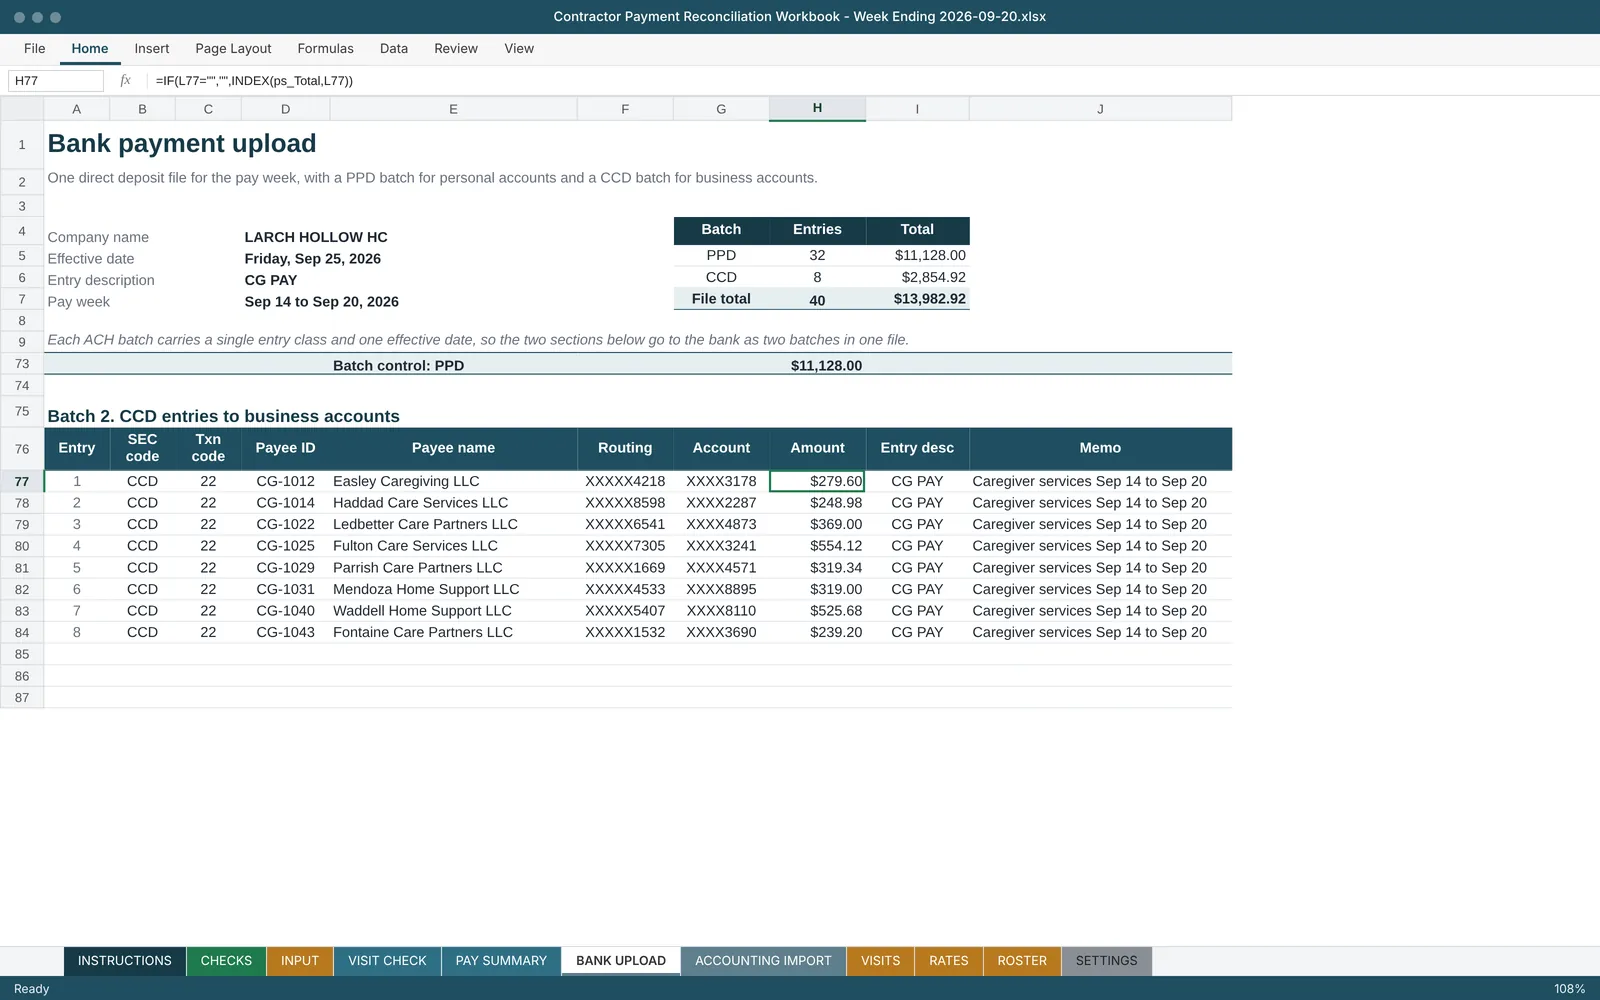
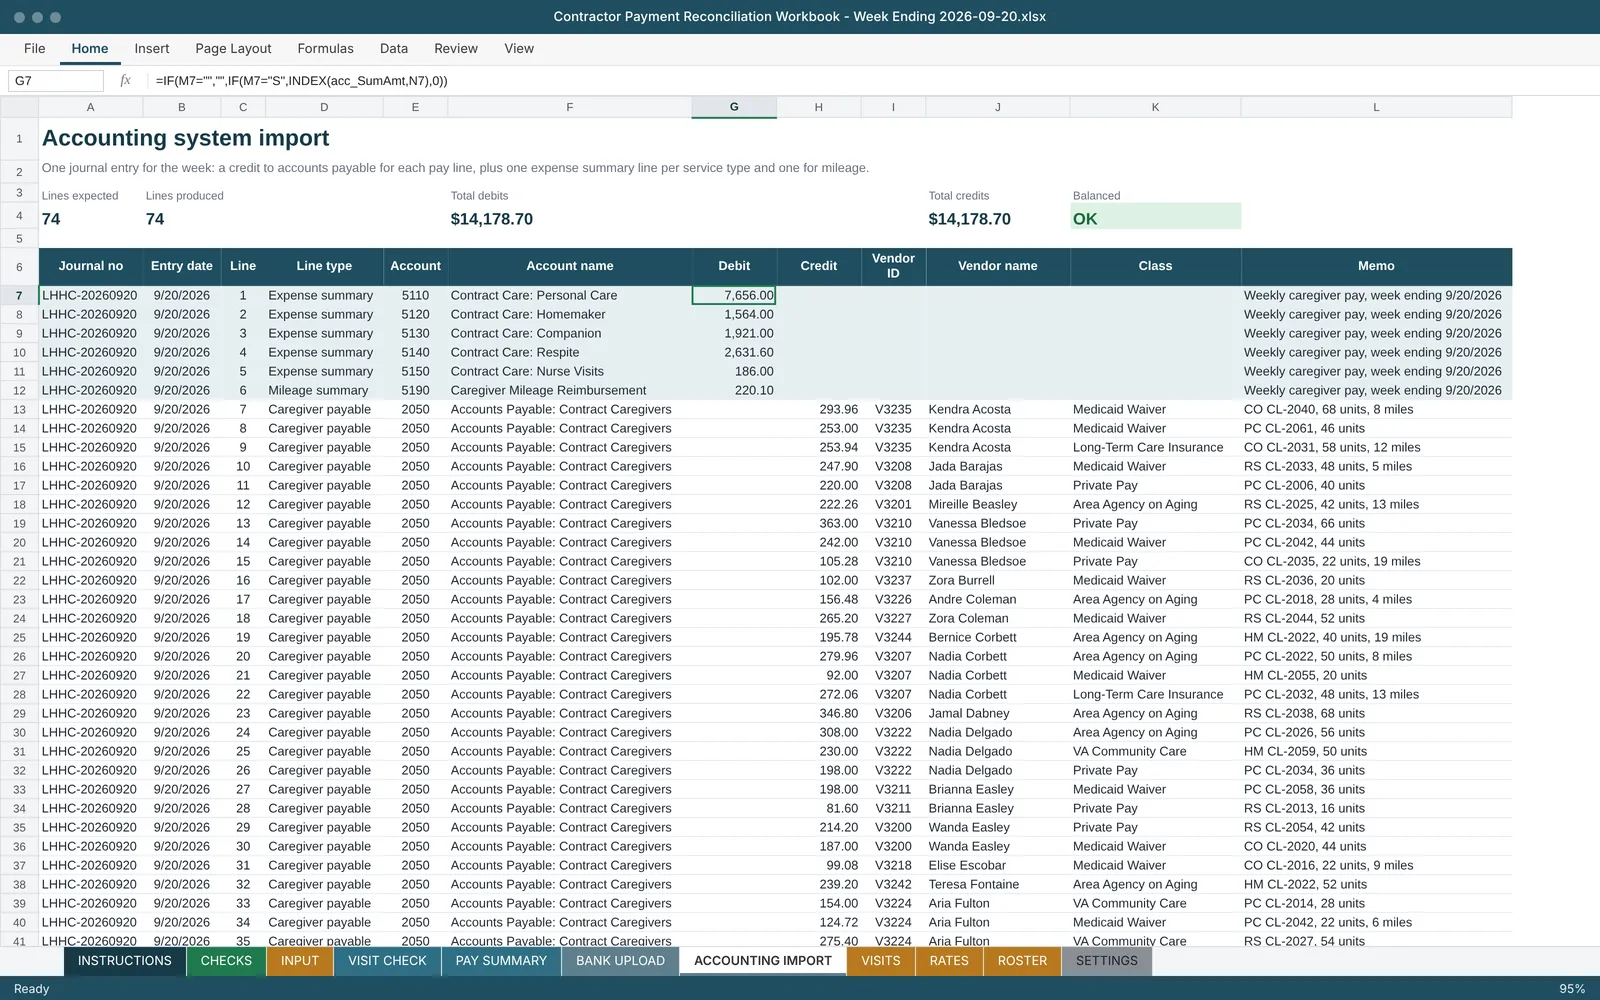
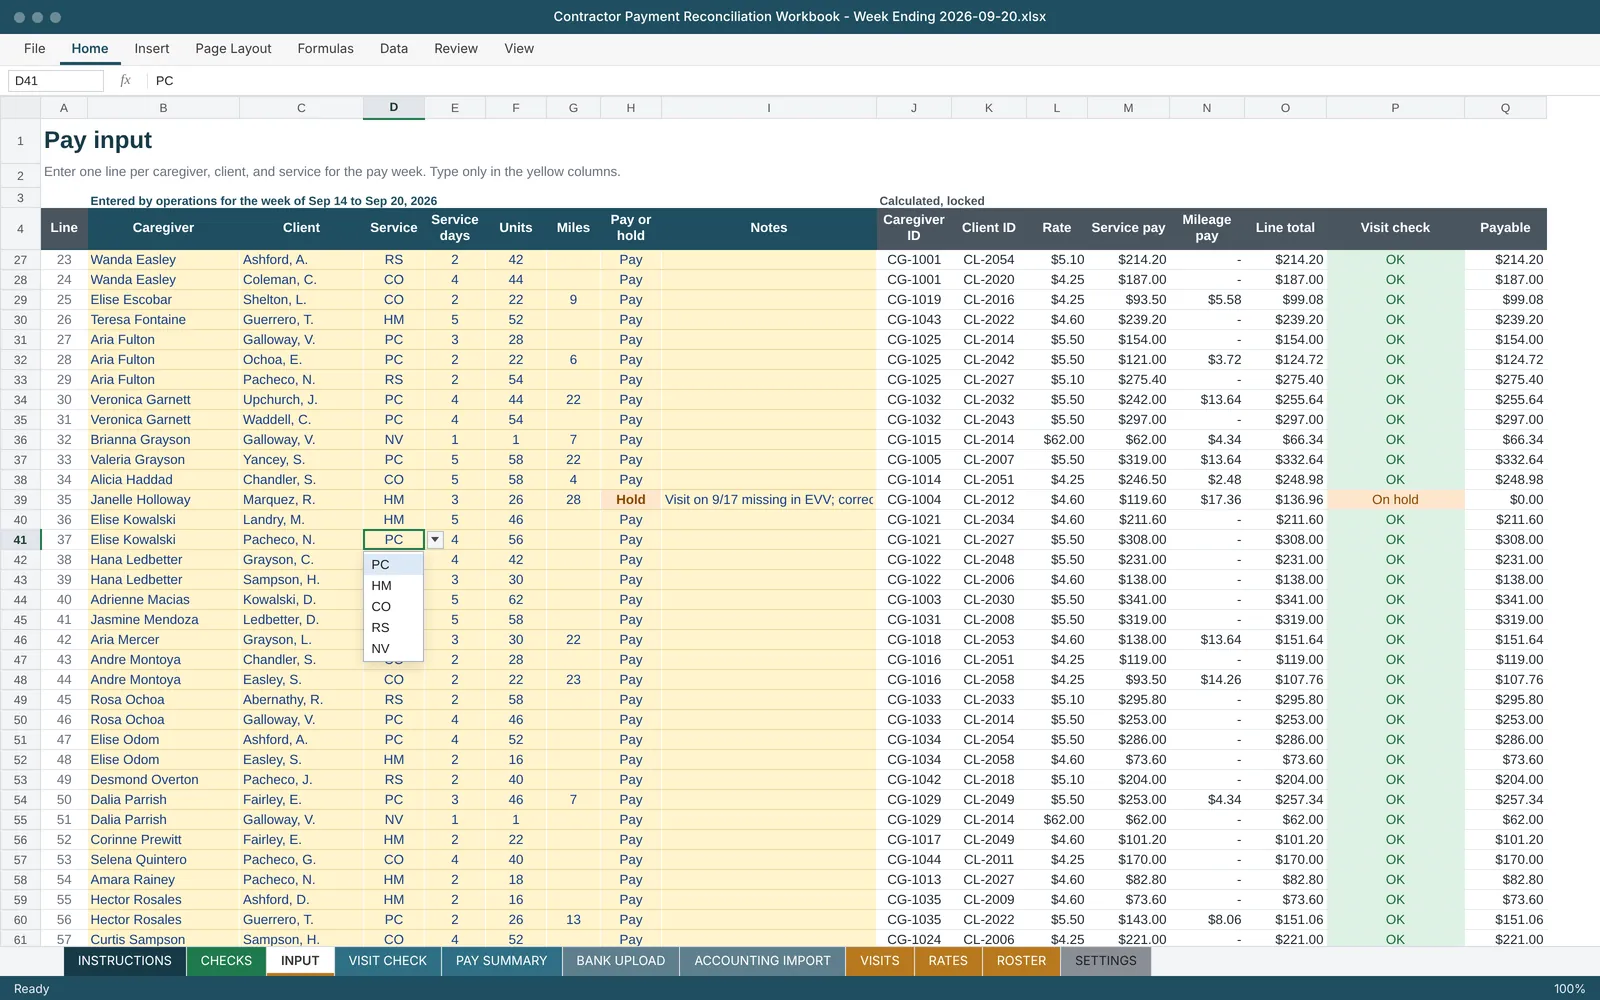
Operations enters service days, units, and miles for each caregiver, client, and service on one input sheet for the pay week. The workbook prices each line from a rates table, then compares it with the visit verification export by caregiver, client, and service type, so any unit without a matching verified visit in the pay week is flagged before payment. From there it builds a single bank upload sheet with a PPD batch for personal accounts and a CCD batch for business accounts, and an accounting import that credits accounts payable once for each pay line and debits expense with one summary line per service type and one for mileage.

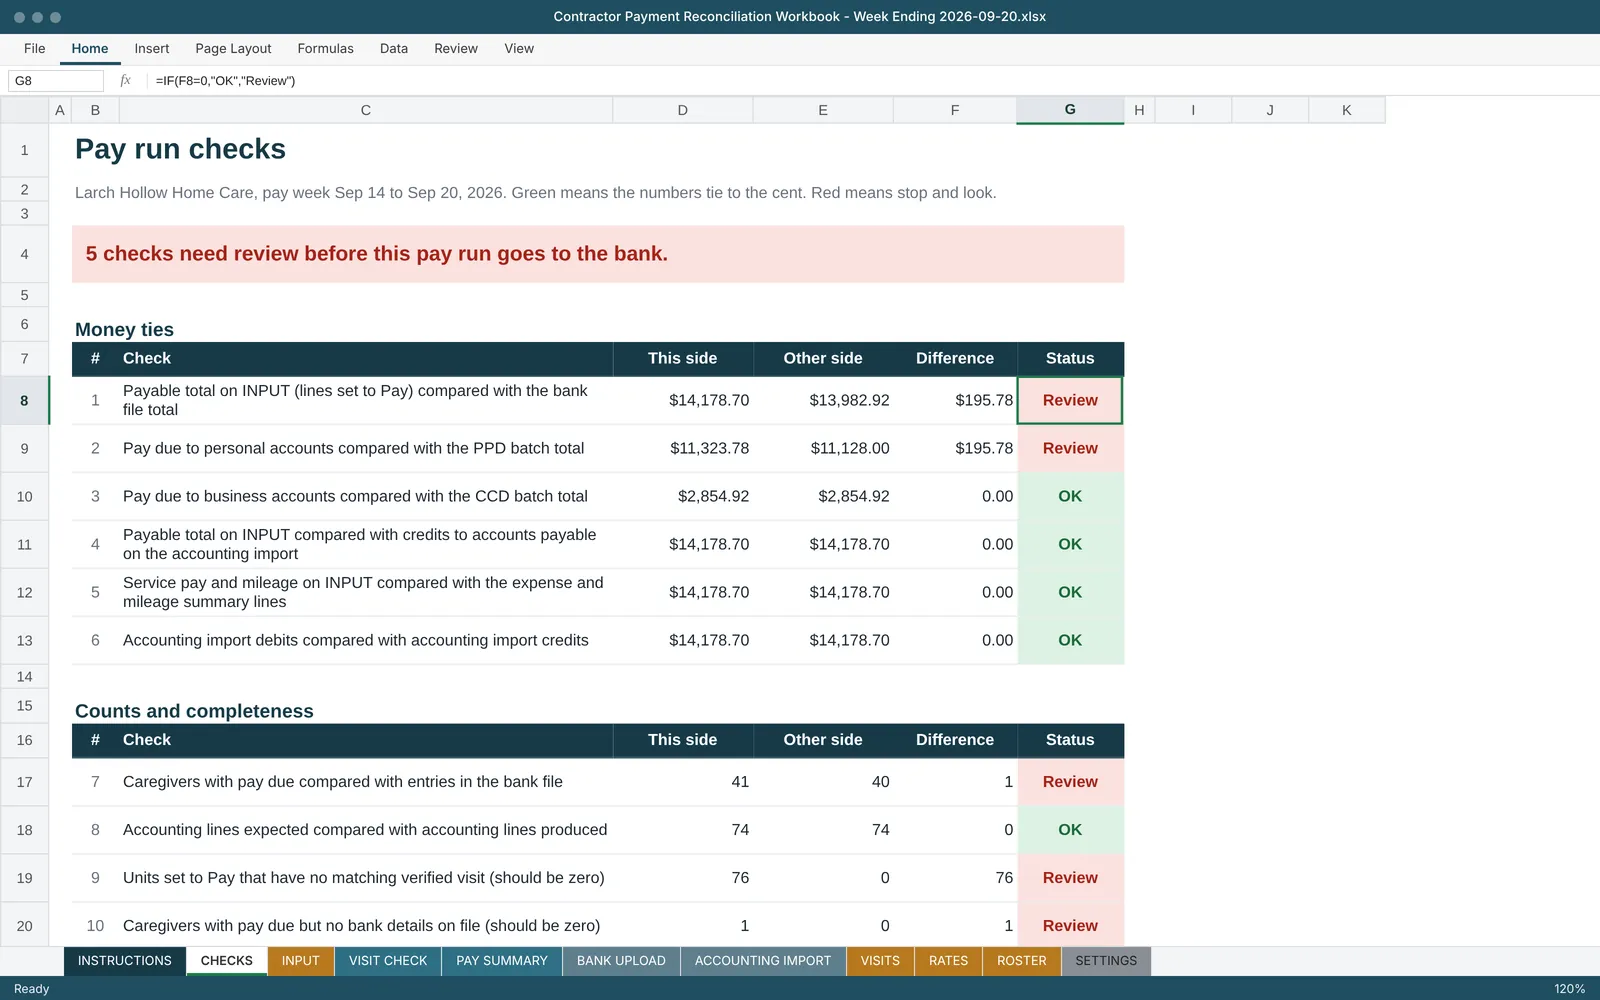
A checks sheet ties the input total to the bank file and to the journal entry to the cent and counts exceptions. The sample has three planted problems (units keyed higher than the visits support, a wrong service code, and a new caregiver with no bank details on file), so five checks show red and the reader can see how each one is caught.
What it includes

  • One weekly input sheet with drop-downs for caregiver, client, service, and pay or hold
  • Visit check that compares entered units with verified visits in the pay week and flags anything unmatched
  • One bank upload sheet with a PPD batch section and a CCD batch section
  • Journal entry with one payable line per pay line and one expense summary line per service type
  • Checks sheet that ties input, bank, and accounting totals to the cent
  • Settings sheet for the pay week, bank date, mileage rate, and account numbers
  • Protected formulas, yellow input cells, and plain-English instructions

Screenshots

Select an image to see it larger.

More in Dashboards and Business Intelligence

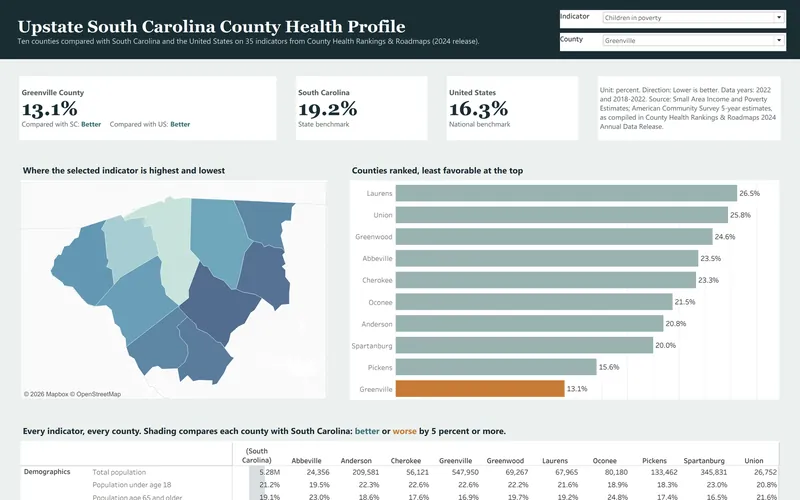
County Health Profile: Upstate South Carolina

This is the secondary data profile from a community health needs assessment for ten Upstate South Carolina counties, and it is built from the 2024 County Health Rankings release. It compares 35 county indicators with state and national values and turns them into a dashboard, a 14-page report and an Excel workbook.

  • Excel
  • Tableau
  • PDF report

Public data

Community Health Survey Results

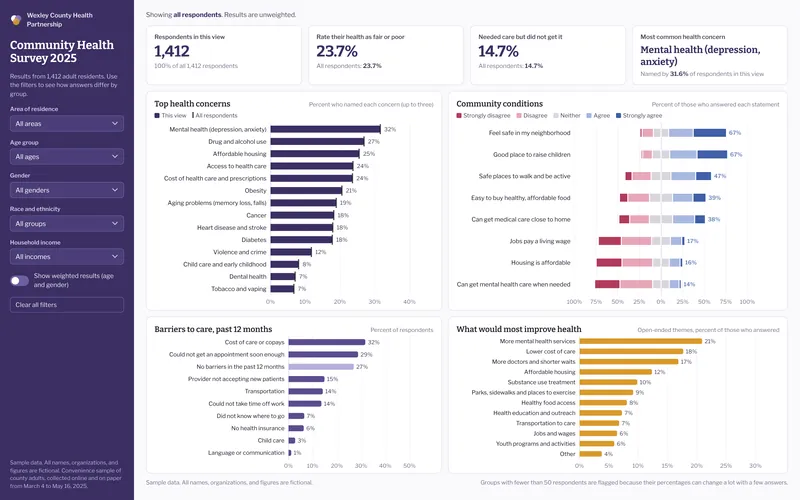
This sample analyzes a fictional county community health survey with 1,412 respondents, which is the kind of survey hospitals run as part of a community health needs assessment. It includes a filterable dashboard, an 8-page results brief and an Excel workbook with crosstabs, a codebook and weighting.

  • Excel
  • Power BI
  • PDF report

Sample data